R 的生存分析
Heidi Seibold
Statistician at LMU Munich
library(survminer)

ggsurvplot(fit)
ggsurvplot(
  fit, palette = NULL, linetype = 1,
  surv.median.line = "none", risk.table = FALSE,
  cumevents = FALSE, cumcensor = FALSE,
  tables.height = 0.25,
  ...
)
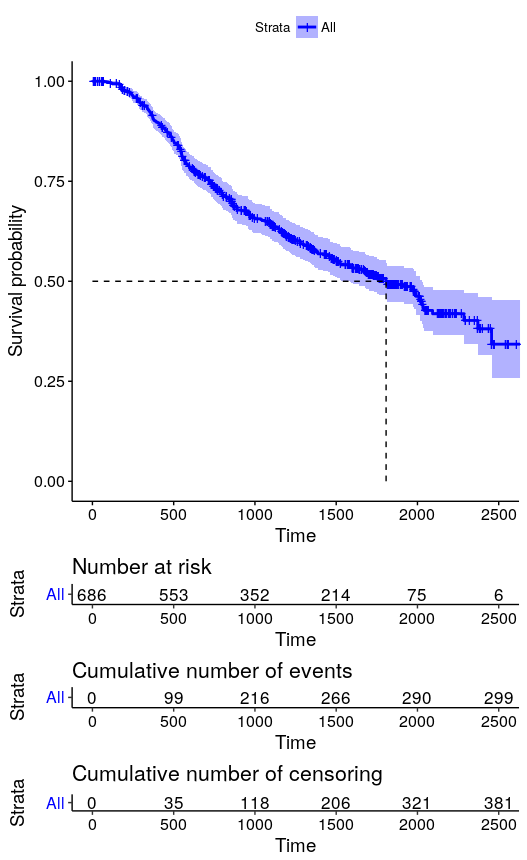
ggsurvplot(
  fit = km,
  palette = "blue",
  linetype = 1,
  surv.median.line = "hv",
  risk.table = TRUE,
  cumevents = TRUE,
  cumcensor = TRUE,
  tables.height = 0.1
)
survfit(object)
object
formula
coxph
survreg