線性迴歸

Python 機率基礎

Alexander A. Ramírez M.

CEO @ Synergy Vision

線性函式
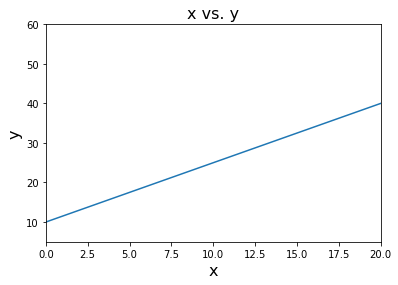
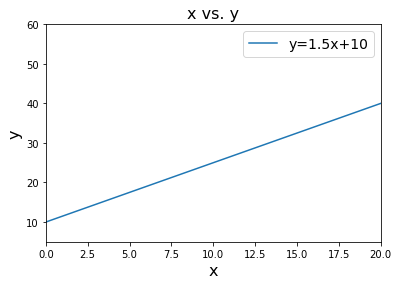
線性函式圖

Python 機率基礎

線性函式的參數

線性函式圖

$$ y = \color{red}{slope}*x + \color{blue}{intercept} $$

Python 機率基礎

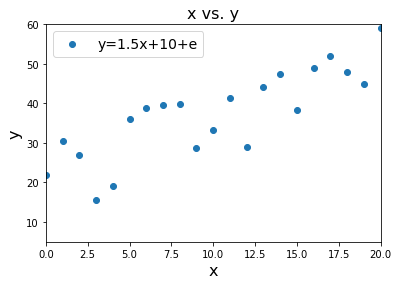
含隨機擾動的線性函式

含隨機擾動的線性函式圖

$$ y = slope*x + intercept + \color{red}{random\_number} $$

Python 機率基礎

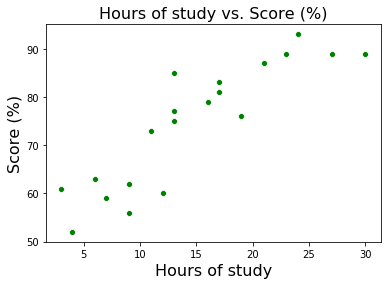
從資料出發,找出合適的模型

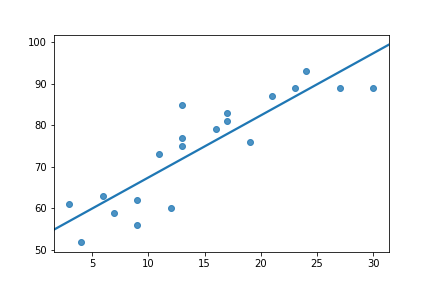
讀書時數與分數散佈圖

Python 機率基礎

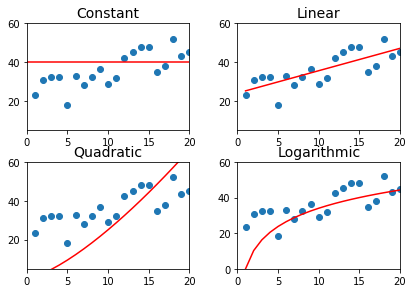
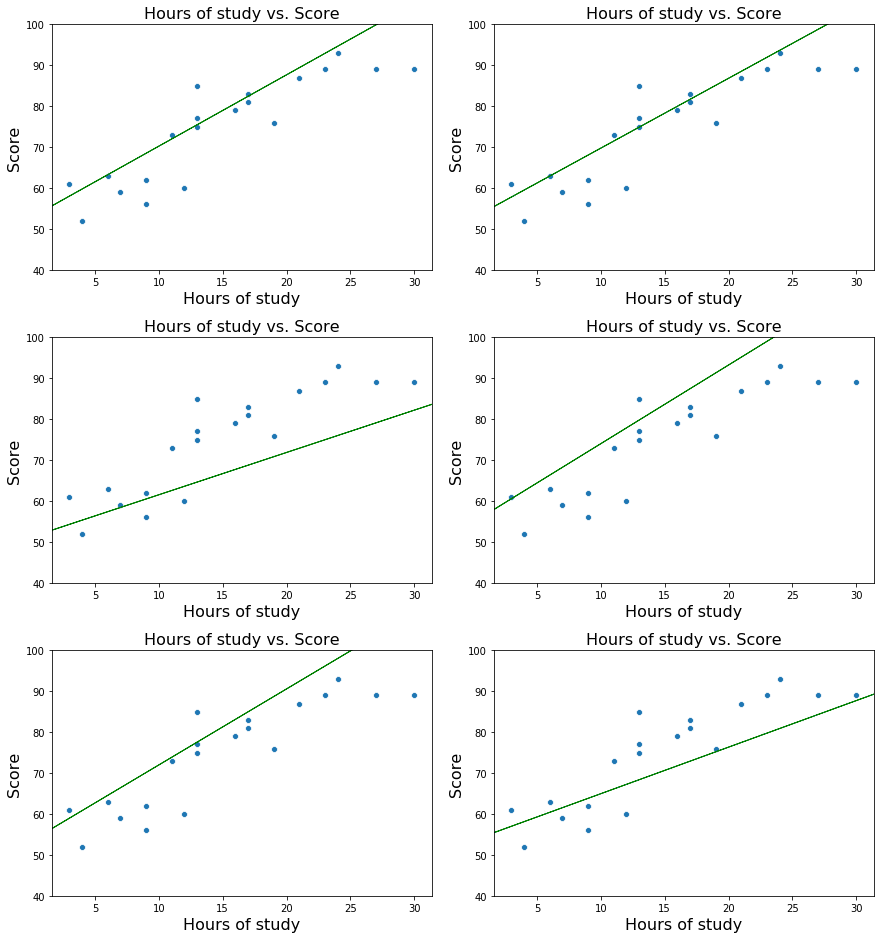
哪個模型最能擬合資料?

以常數、線性、二次與對數模型擬合資料

用什麼準則判定哪個模型最好?

Python 機率基礎

哪個模型最能擬合資料?(續)

線性模型動畫圖

Python 機率基礎

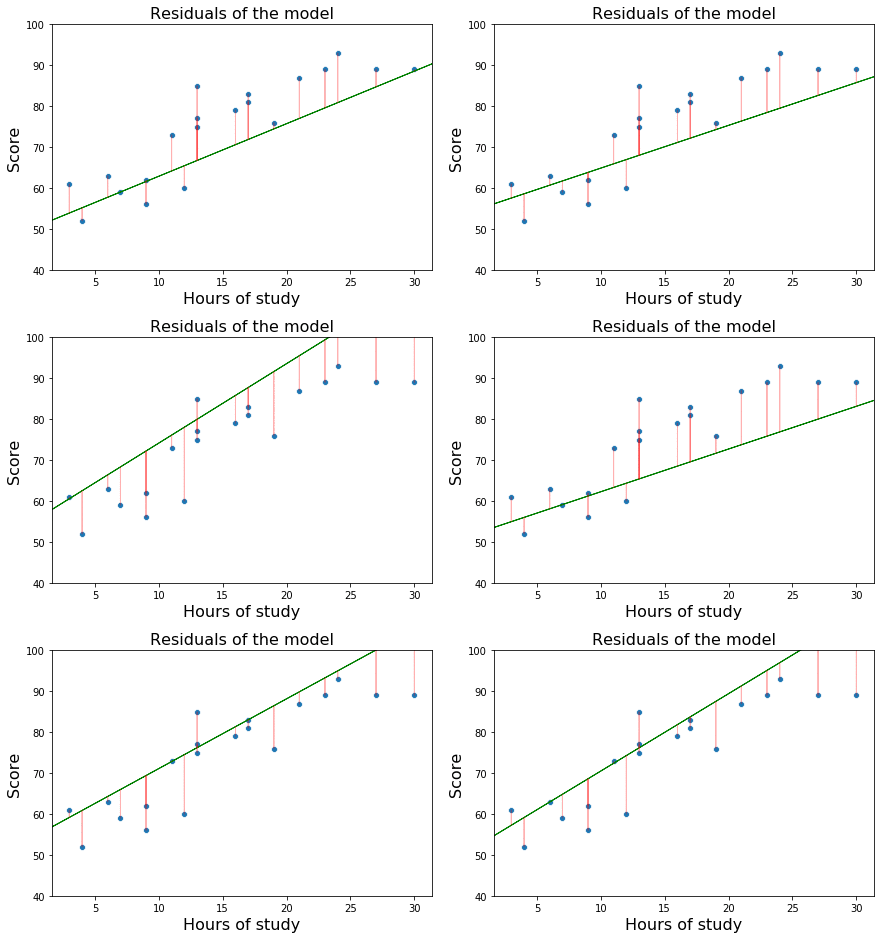
殘差圖

Python 機率基礎

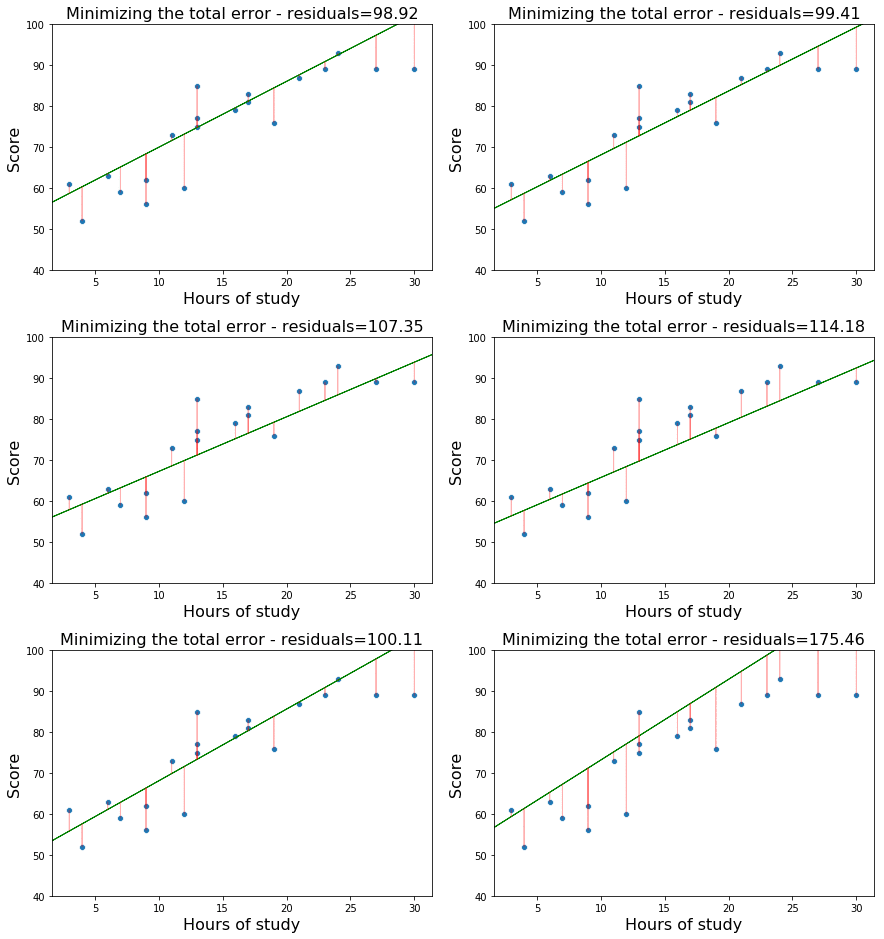
殘差圖與誤差最小化

Python 機率基礎

機率與統計的實作

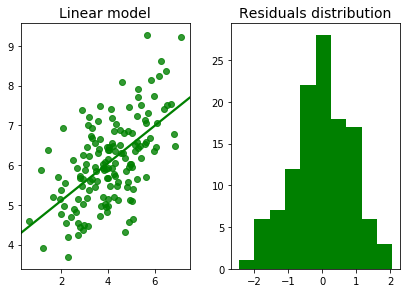
線性模型殘差圖

Python 機率基礎

計算線性模型參數

# Import LinearRegression
from sklearn.linear_model import LinearRegression
# sklearn linear model
model = LinearRegression()
model.fit(hours_of_study, scores)
# Get parameters
slope = model.coef_[0]
intercept = model.intercept_
# Print parameters
print(slope, intercept)
(1.496703900384545, 52.44845266434719)
Python 機率基礎

依讀書時數預測分數

# Score prediction
score = model.predict(np.array([[15]]))
print(score)
[74.89901117]
Python 機率基礎

繪製線性模型

$$ $$

import matplotlib.pyplot as plt
plt.scatter(hours_of_study, scores)
plt.plot(hours_of_study_values, model.predict(hours_of_study_values))
plt.show()
Python 機率基礎

線性模型擬合圖

Python 機率基礎

一起來練習吧!

Python 機率基礎

Preparing Video For Download...