繪製 Poisson 迴歸
R 的廣義線性模型

Richard Erickson
Instructor
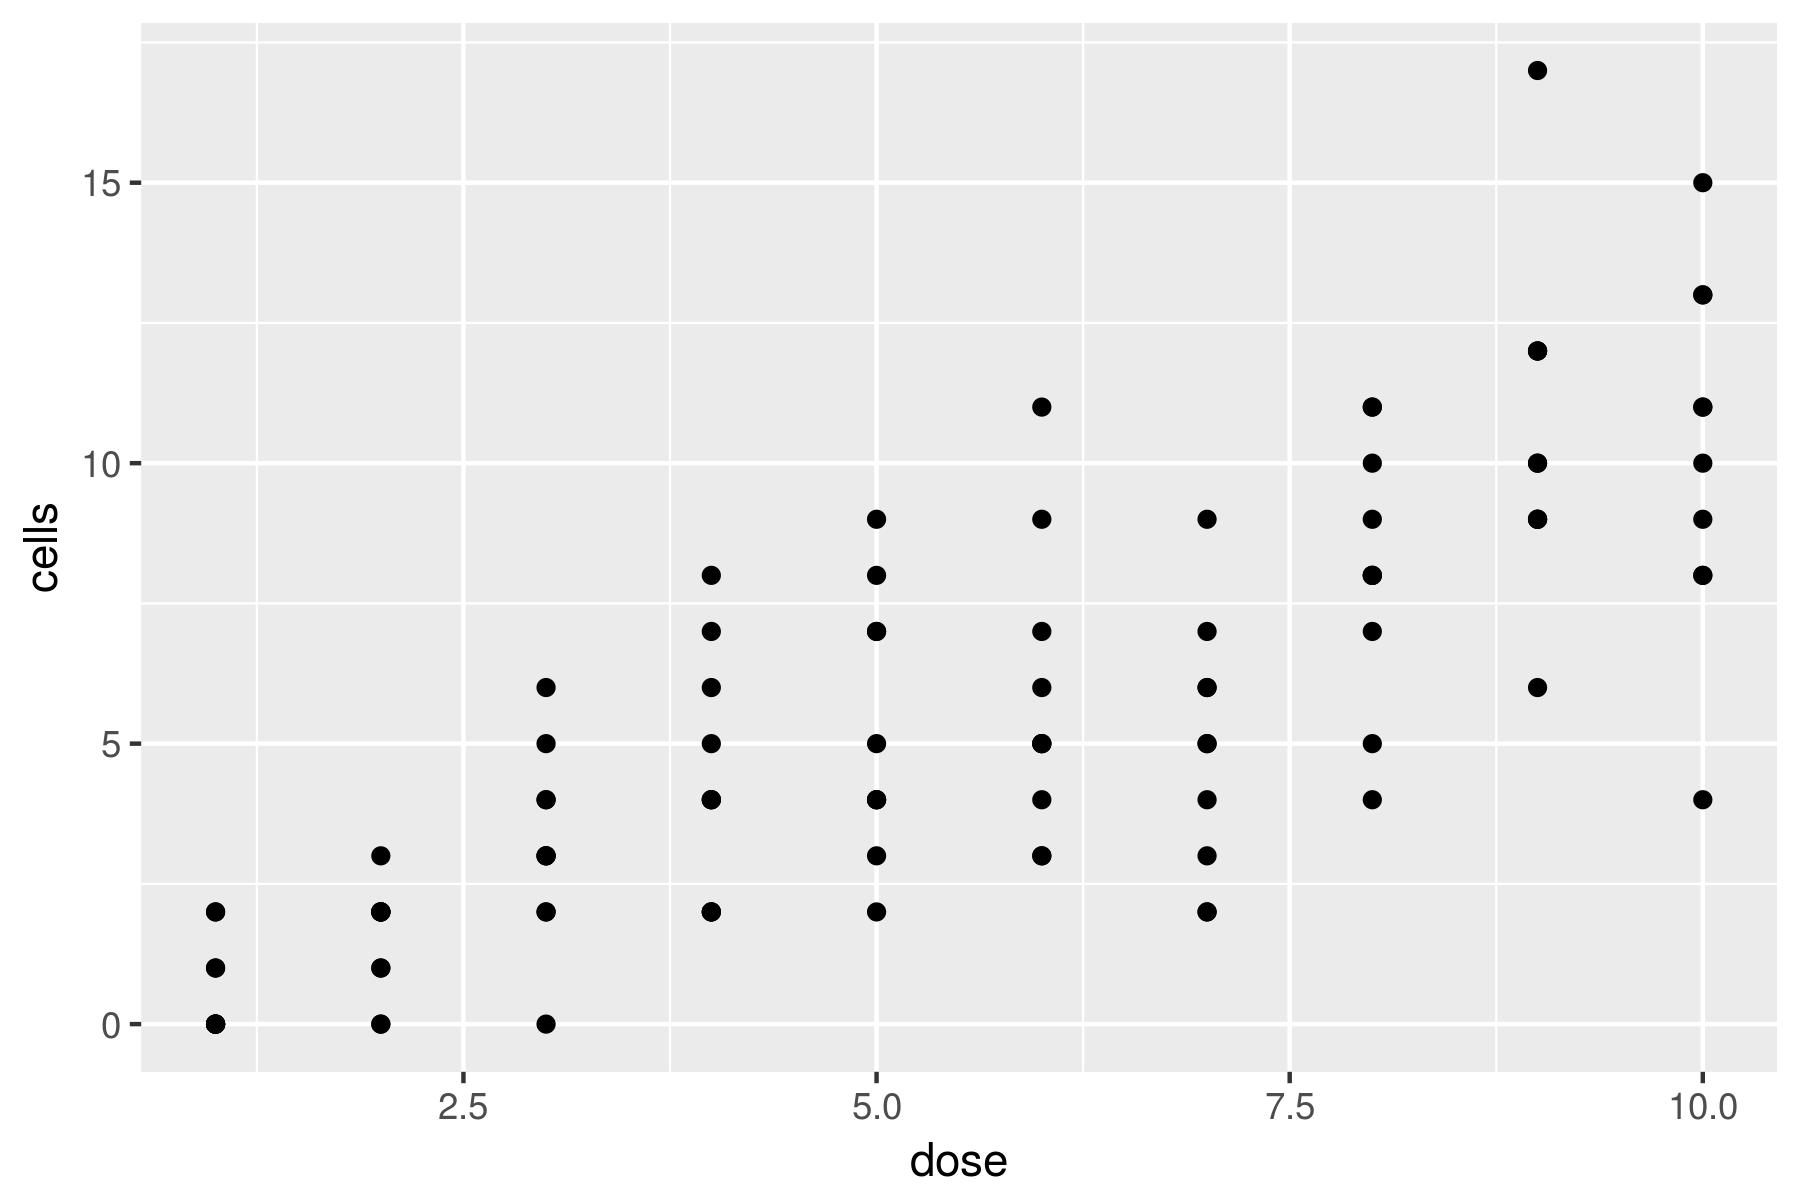
繪製散點
ggplot(data = dat, aes(x = dose, y = cells)) +
    geom_point()
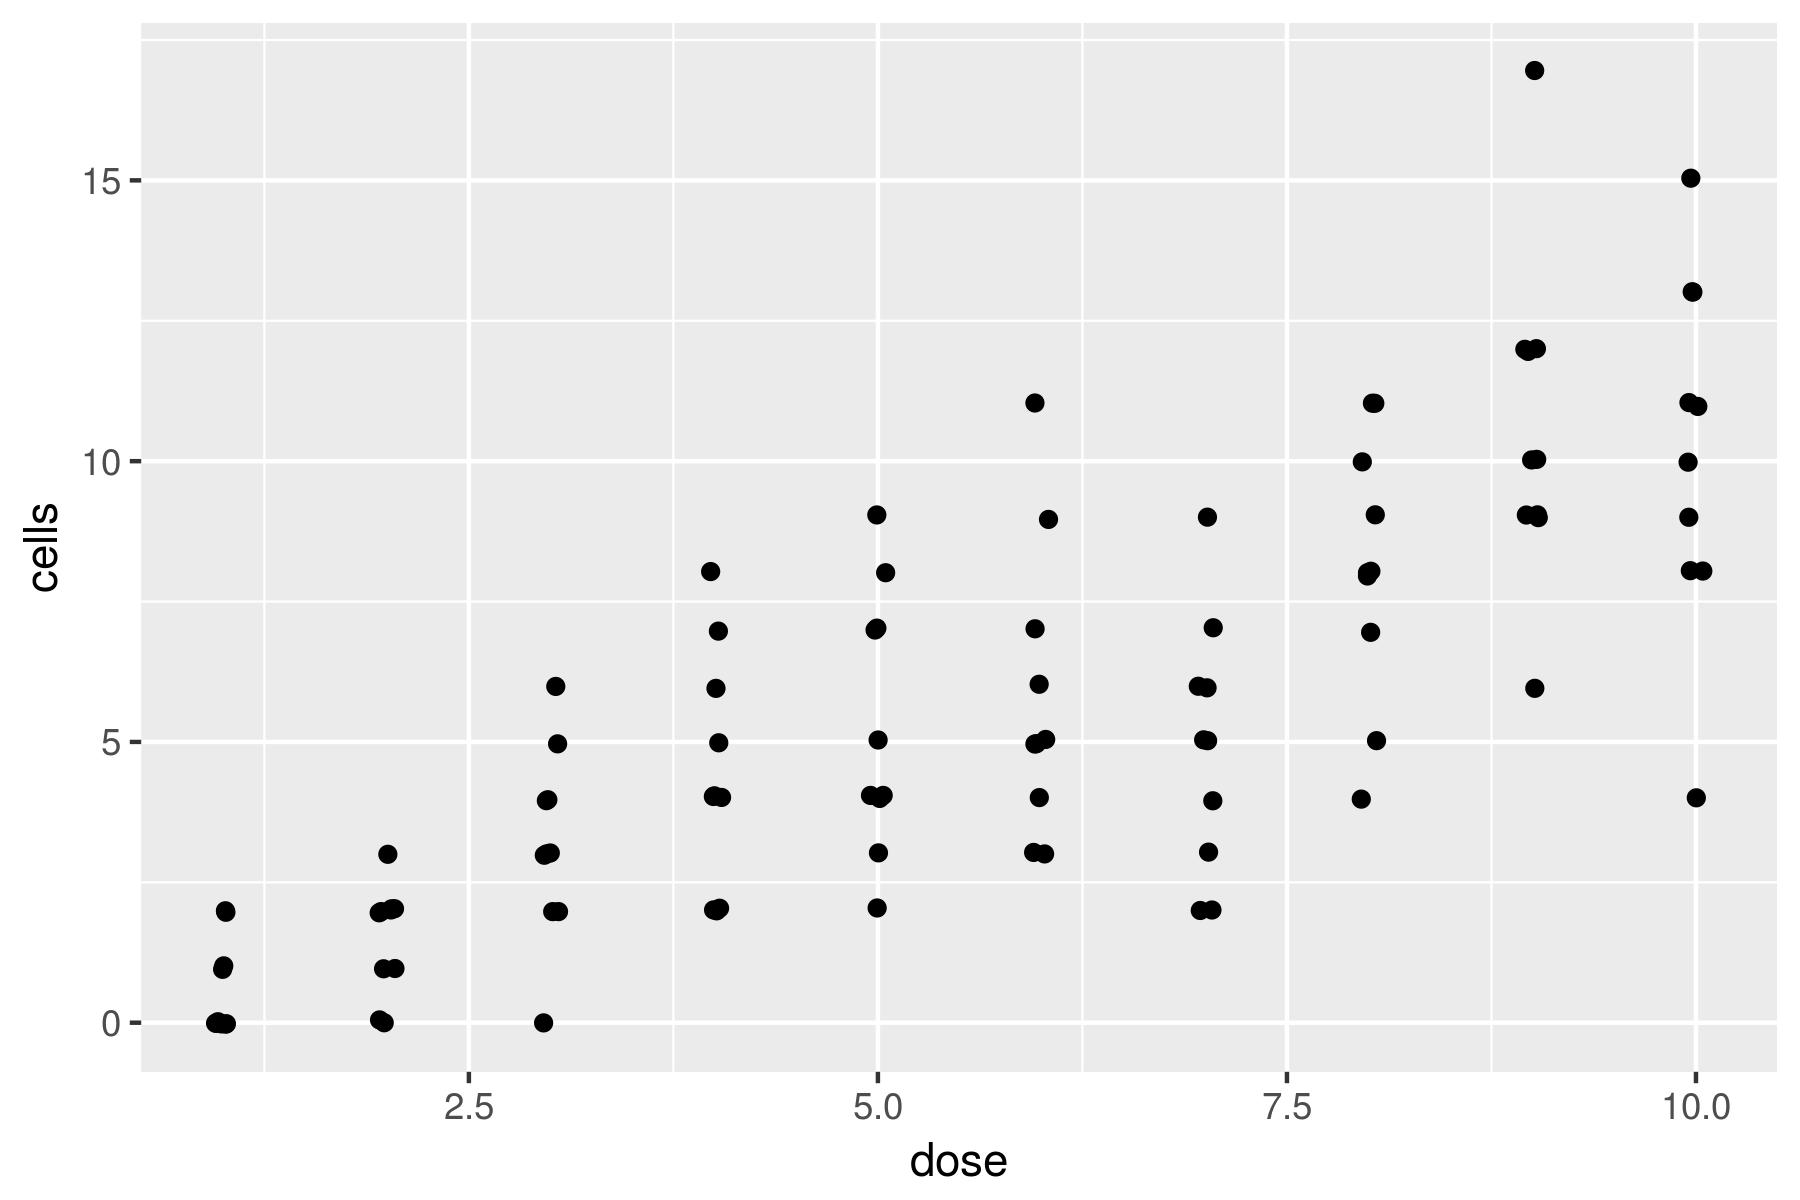
抖動散點
ggplot(data = dat, aes(x = dose, y = cells)) +
   geom_jitter(width = 0.05, height = 0.05)
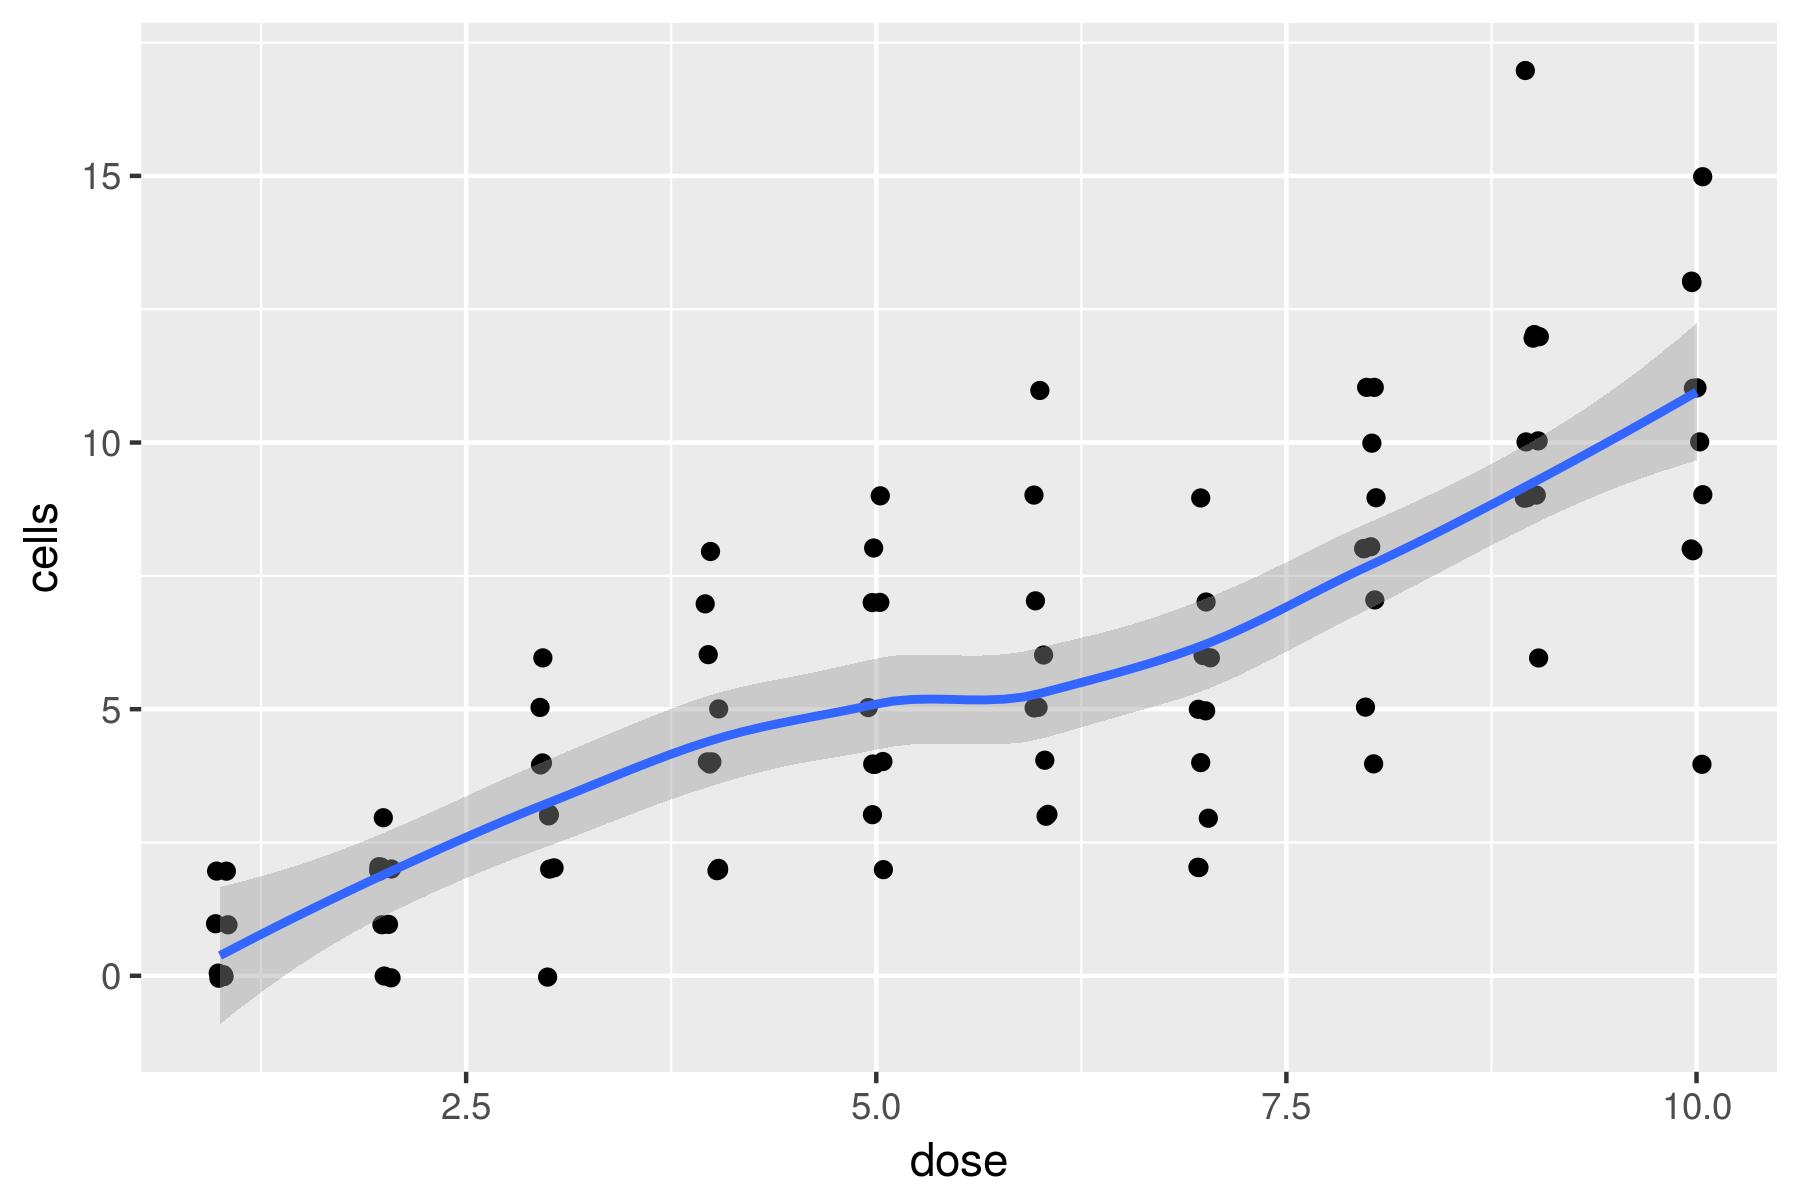
geom_smooth()
ggplot(data = dat, aes(x = dose, y = cells)) +
   geom_jitter(width = 0.05, height = 0.05)
   geom_smooth()
在 geom_smooth() 中使用 GLM
ggplot(data = dat, aes(x = dose, y = cells)) +
   geom_jitter(width = 0.05, height = 0.05)
   geom_smooth(method = 'glm')
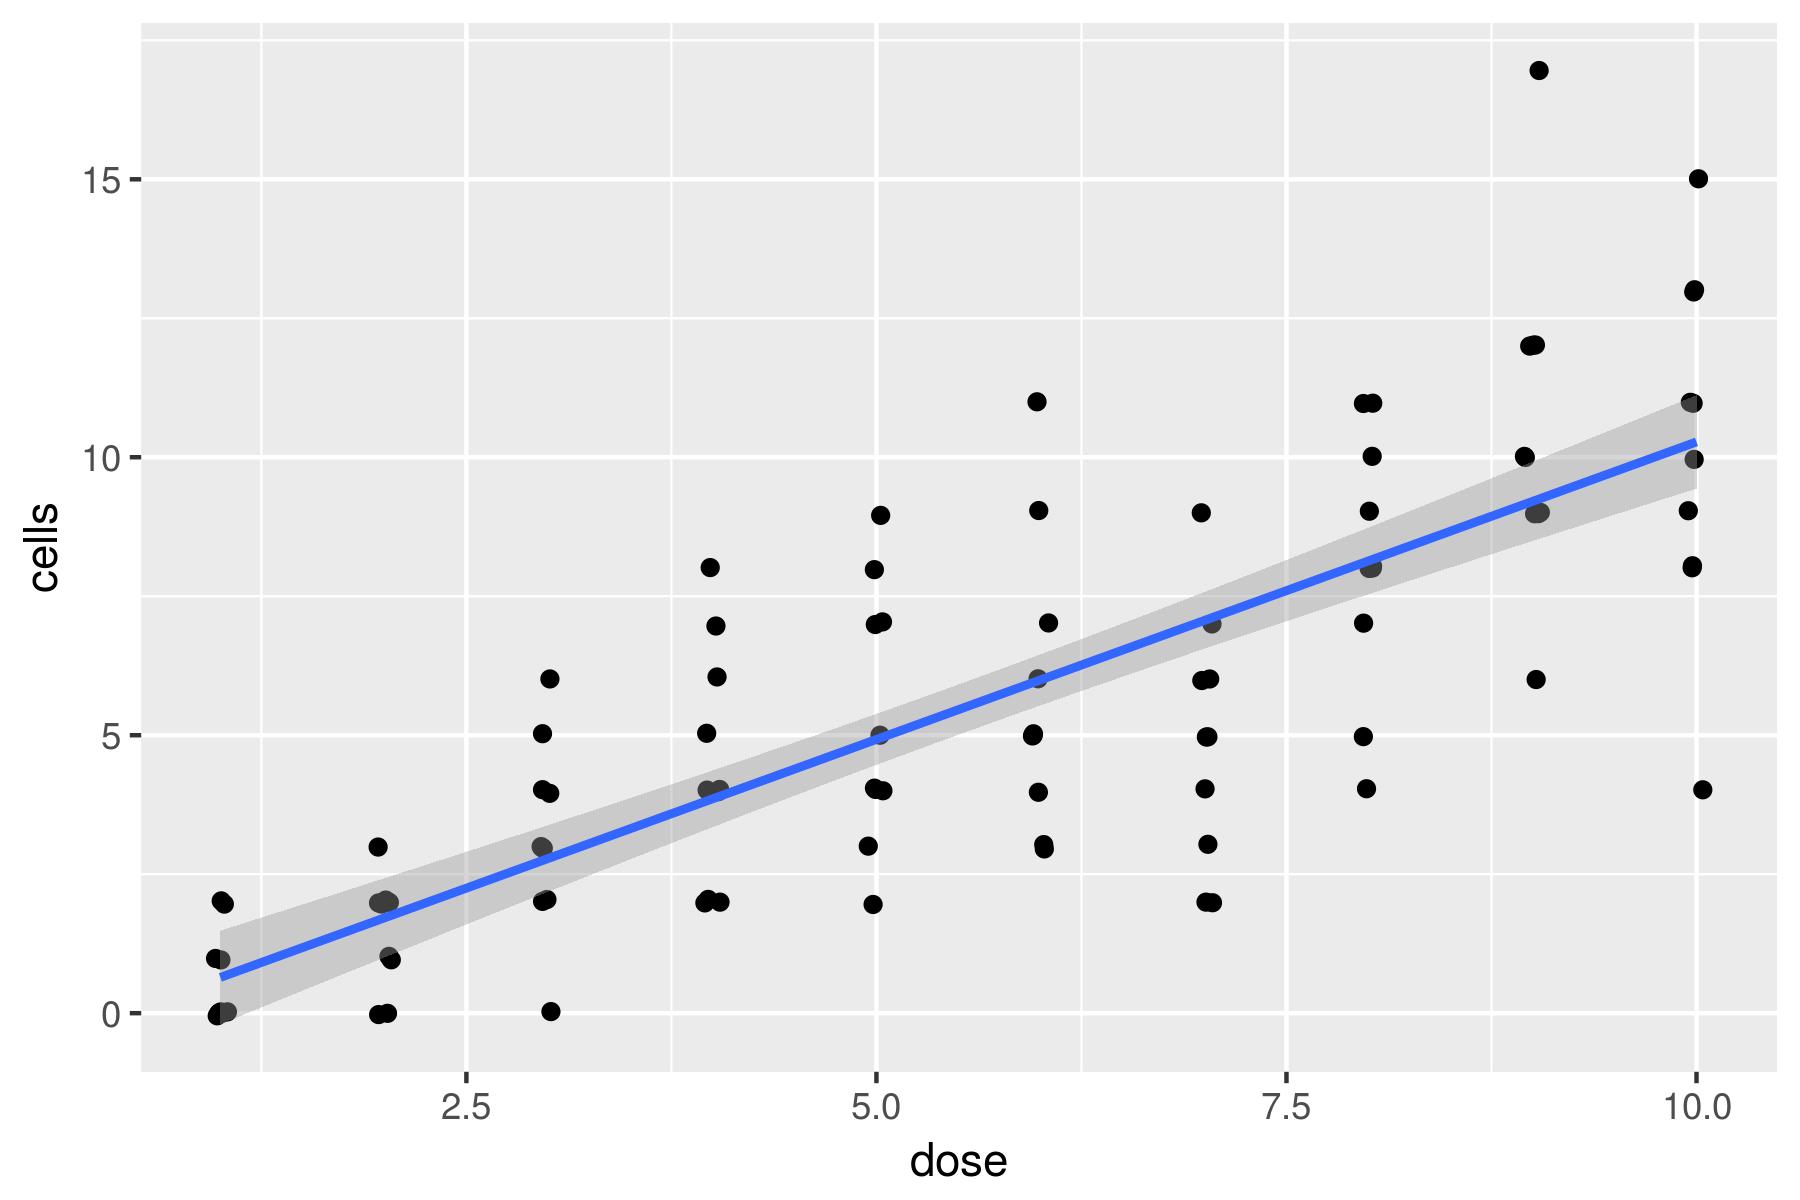
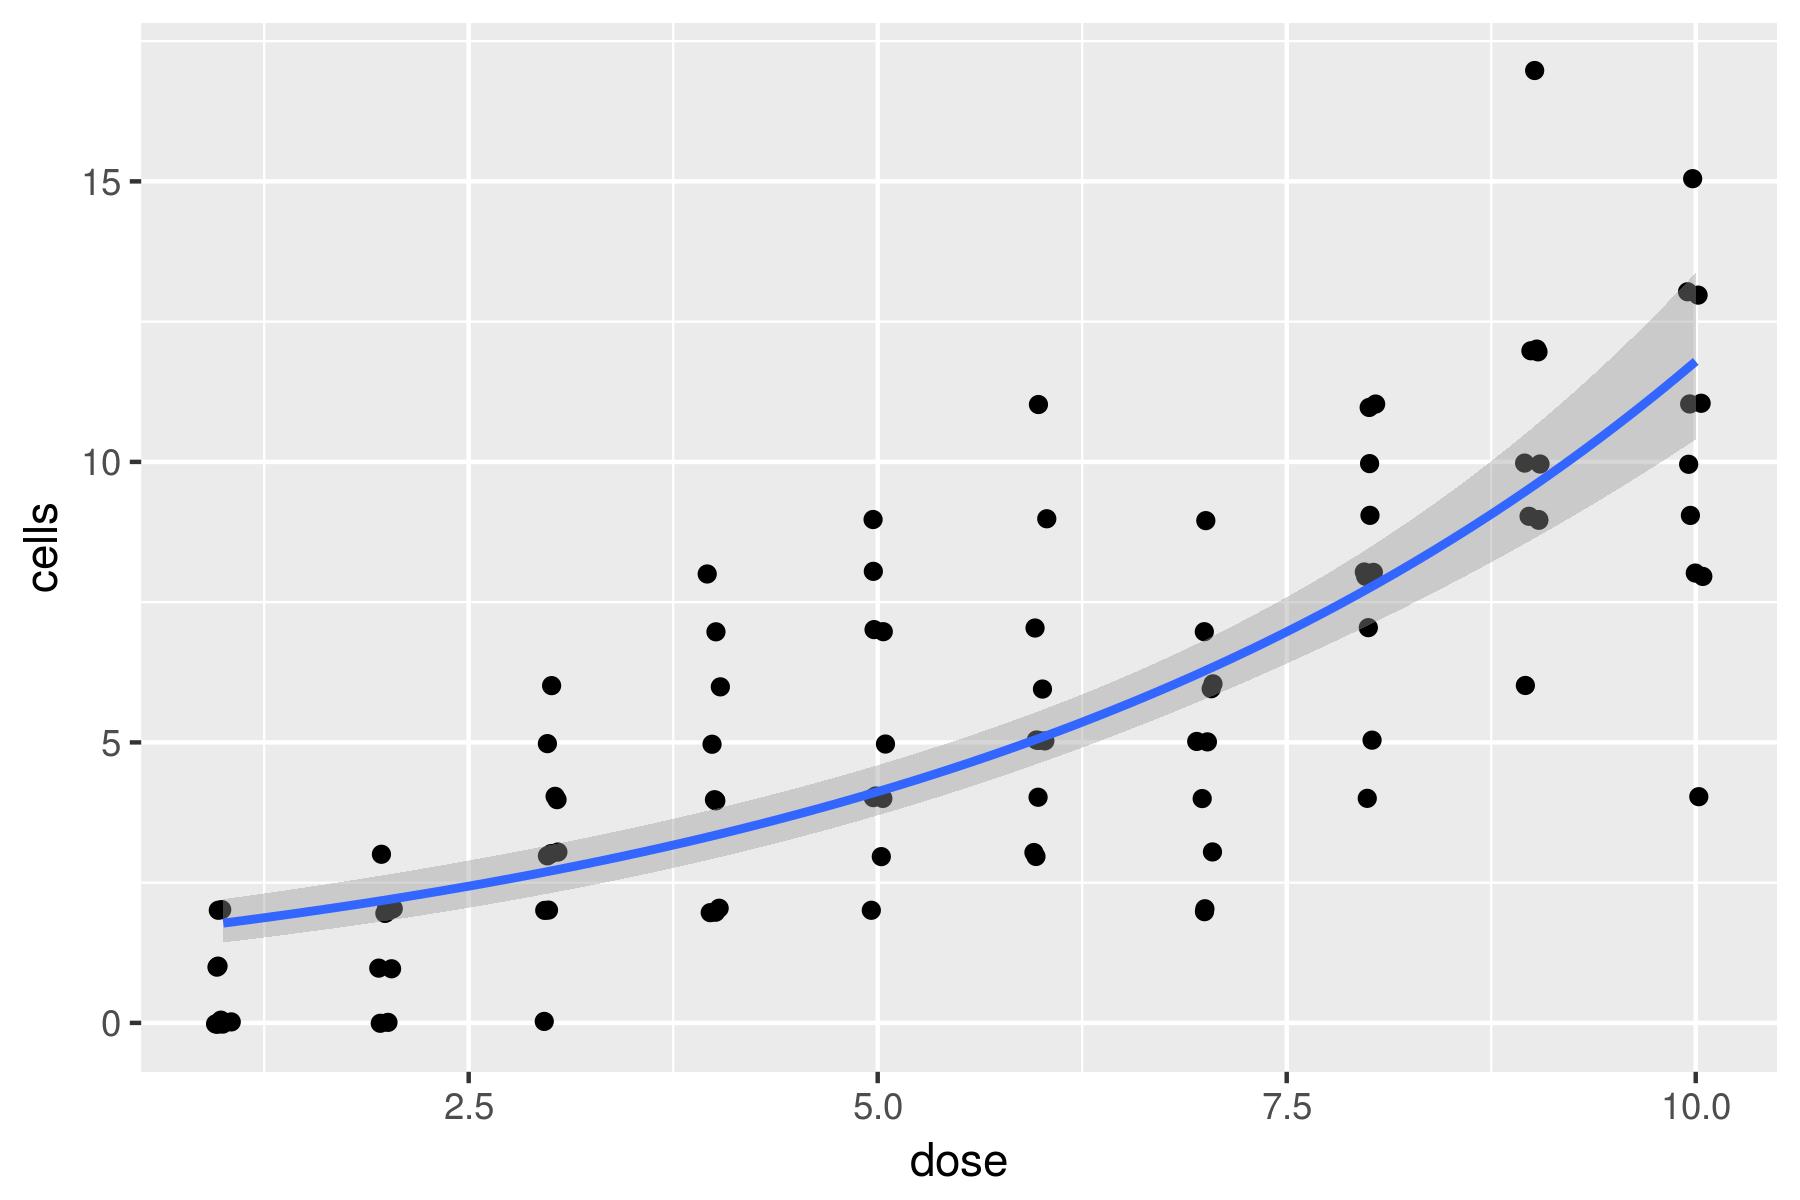
在 geom_smooth() 中的 Poisson GLM
ggplot(data = dat, aes(x = dose, y = cells)) +
   geom_jitter(width = 0.05, height = 0.05) +
   geom_smooth(method = 'glm', method.args = list(family = 'poisson'))