盒鬚圖的替代方案
R 視覺化最佳實務

Nick Strayer
Instructor
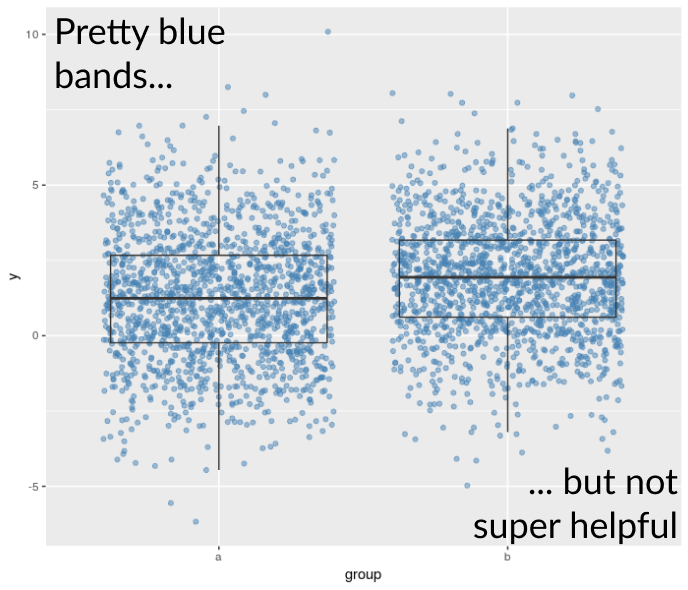
盒鬚圖加抖動的限制
- 抖動點無法處理過多重疊
- 難以看出資料密度
還有哪些選項?
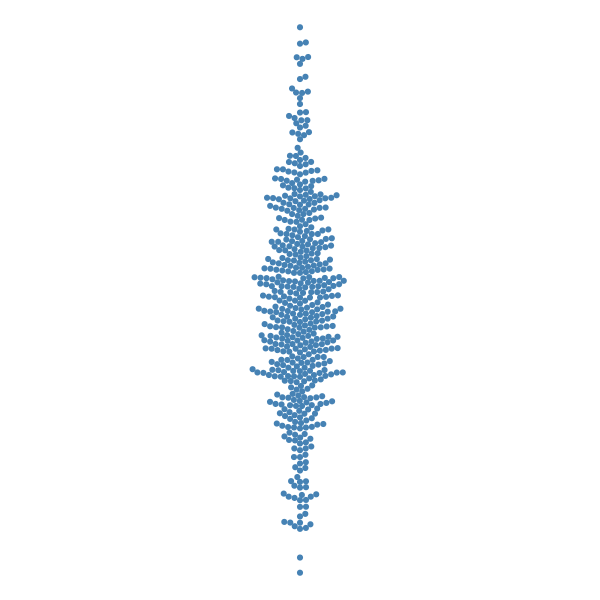
Beeswarm 圖
Violin 圖

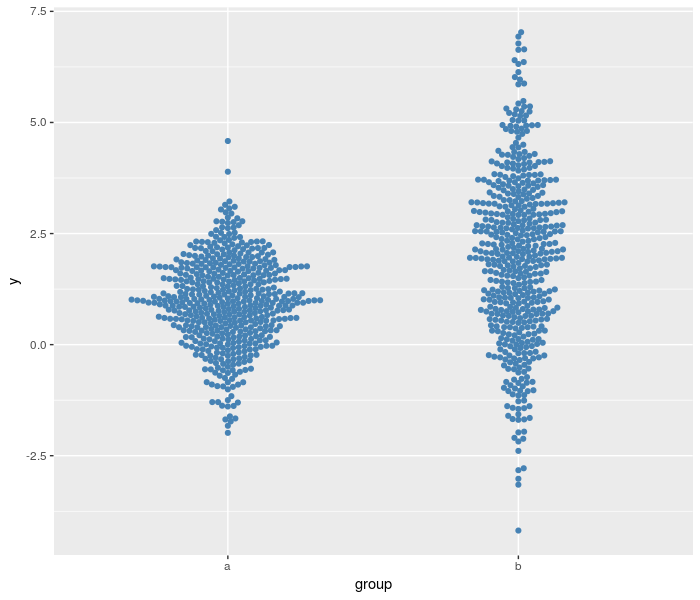
Beeswarm 優點
- 顯示個別資料點
- 呈現分布形狀
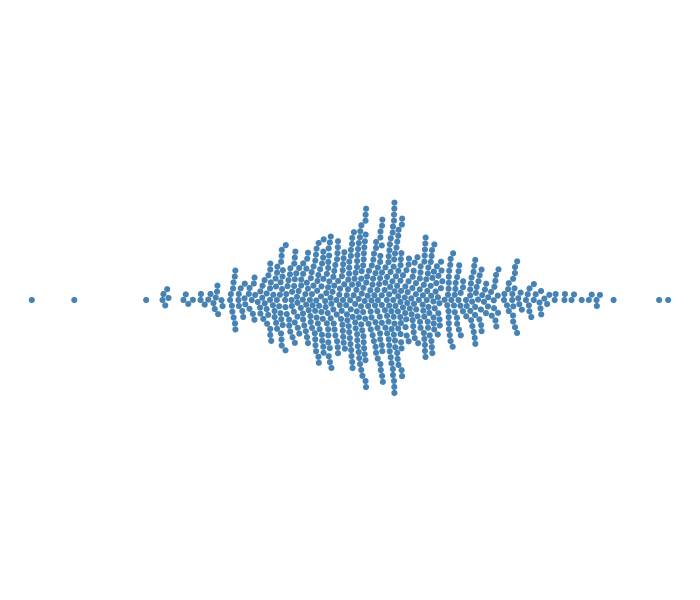
Beeswarm 缺點
- 資料很多時變得難讀
- 疊放方式較任意

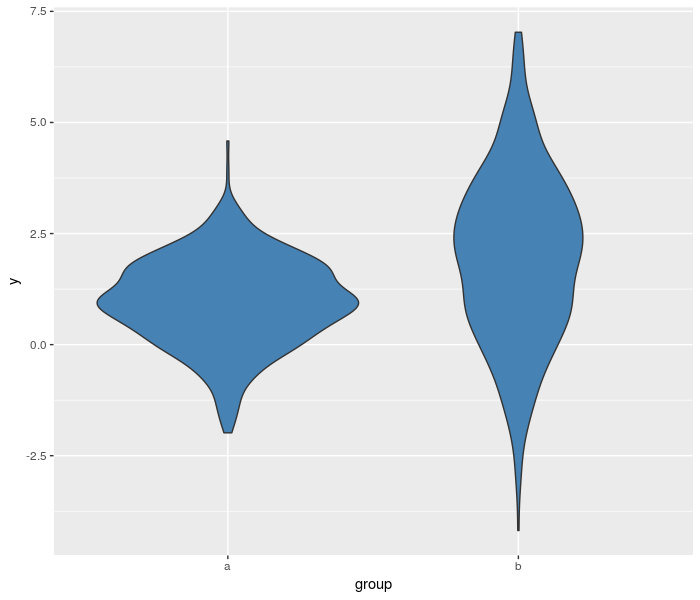
Violin 優點
- 每個資料點都被「納入」
- 不必顯示每個點,適合大量資料。

Violin 缺點
- 核寬(bandwidth)選擇影響結果
- 並非每個資料點都可見
R 視覺化最佳實務
Nick Strayer
Instructor
Beeswarm 圖
Violin 圖

