相關性

使用 Python 分析 IoT 資料

Matthias Voppichler

IT Developer

df.corr()

print(data.corr())
             temperature  humidity  sunshine  light_veh  heavy_veh
temperature     1.000000 -0.734430  0.611041   0.401997   0.408936
humidity       -0.734430  1.000000 -0.637761  -0.313952  -0.318198
sunshine        0.611041 -0.637761  1.000000   0.408854   0.409363
light_veh       0.401997 -0.313952  0.408854   1.000000   0.998473
heavy_veh       0.408936 -0.318198  0.409363   0.998473   1.000000
使用 Python 分析 IoT 資料

熱度圖(heatmap)

sns.heatmap(data.corr(), annot=True)

資料相關性的熱度圖

使用 Python 分析 IoT 資料

熱度圖(heatmap)

sns.heatmap(data.corr(), annot=True)
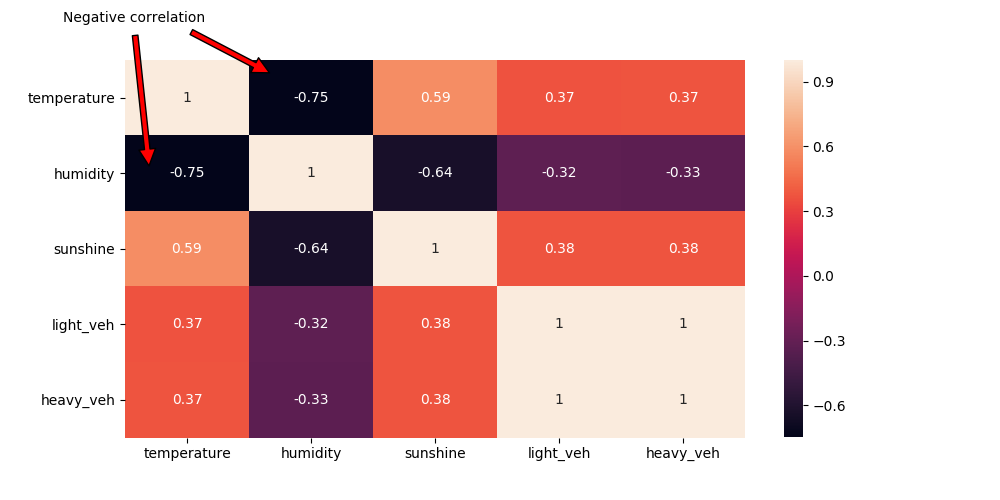
資料相關性的熱度圖-標示高負相關(temperature/humidity)

使用 Python 分析 IoT 資料

熱度圖(heatmap)

sns.heatmap(data.corr(), annot=True)

資料相關性的熱度圖-標示正相關(sunshine/temperature)

使用 Python 分析 IoT 資料

熱度圖(heatmap)

sns.heatmap(data.corr(), annot=True)

資料相關性的熱度圖-標示極高正相關(light/heavy vehicle)

使用 Python 分析 IoT 資料

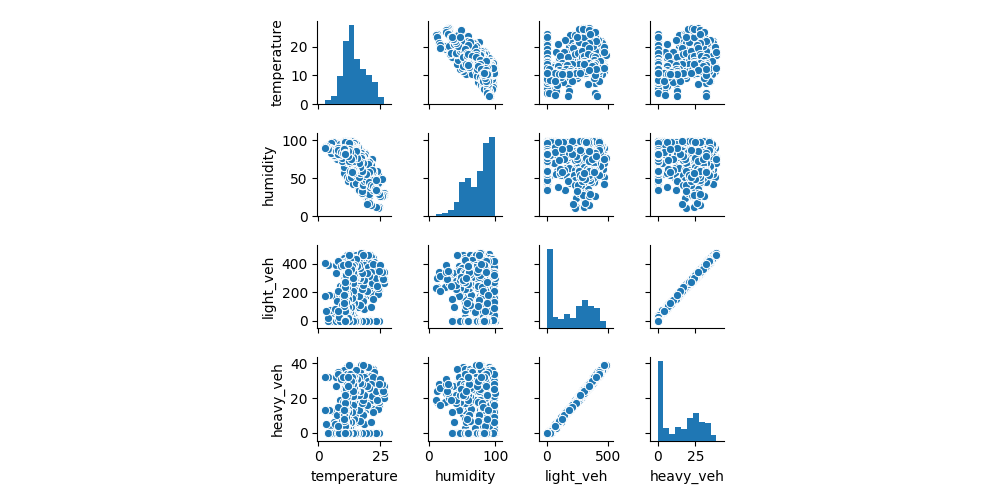
配對圖(Pairplot)

sns.pairplot(data)

4 欄位的配對圖

使用 Python 分析 IoT 資料

重點整理

  • 熱度圖
    • 負相關
    • 正相關
    • 相關係數接近 1
使用 Python 分析 IoT 資料

一起來練習吧!

使用 Python 分析 IoT 資料

Preparing Video For Download...