準備並視覺化增量資料

使用 Python 分析 IoT 資料

Matthias Voppichler

IT Developer

資料準備

  • 透過透視表整理資料
  • 重新取樣
  • 套用 diff()
  • 套用 pct_change()
使用 Python 分析 IoT 資料

資料結構

print(data.head())
                timestamp device   value
0 2018-10-26 06:30:42.817   C331  6020.0
1 2018-10-26 06:30:43.083   M640   104.0
2 2018-10-26 06:31:00.858   M640   126.0
3 2018-10-26 06:31:10.254   C331  6068.0
4 2018-10-26 06:31:10.474   M640   136.0
使用 Python 分析 IoT 資料

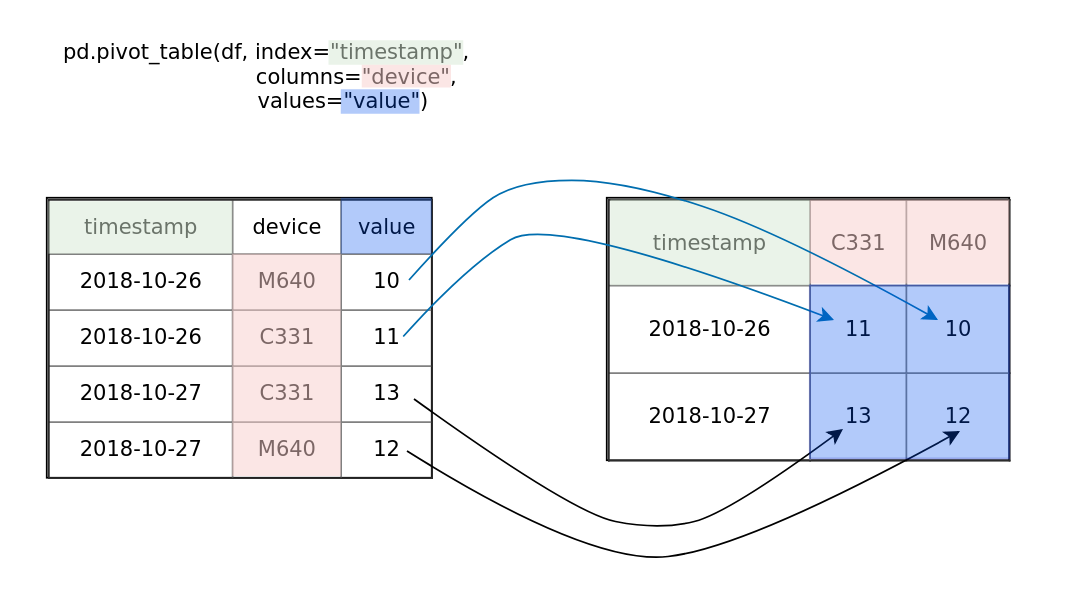
透視表

解說透視表的圖

使用 Python 分析 IoT 資料

套用透視表

                timestamp device   value
0 2018-10-26 06:30:42.817   C331  6020.0
1 2018-10-26 06:30:43.083   M640   104.0
2 2018-10-26 06:31:00.858   M640   126.0
3 2018-10-26 06:31:10.254   C331  6068.0
4 2018-10-26 06:31:10.474   M640   136.0
data = pd.pivot_table(data, columns="device", values="value", index="timestamp")
print(data.head()
device                     C331   M640
timestamp                             
2018-10-26 06:30:42.817  6020.0    NaN
2018-10-26 06:30:43.083     NaN  104.0
2018-10-26 06:31:00.858     NaN  126.0
2018-10-26 06:31:10.254  6068.0    NaN
2018-10-26 06:31:10.474     NaN  136.0
使用 Python 分析 IoT 資料

重新取樣

# 將 DataFrame 重新取樣為 1 分鐘
df = data.resample("1min").max().dropna()
print(df.head())
device                 C331   M640
timestamp                         
2018-10-26 06:30:00  6020.0  104.0
2018-10-26 06:31:00  6129.0  180.0
2018-10-26 06:32:00  6205.0  256.0
2018-10-26 06:33:00  6336.0  332.0
2018-10-26 06:34:00  6431.0  402.0
使用 Python 分析 IoT 資料

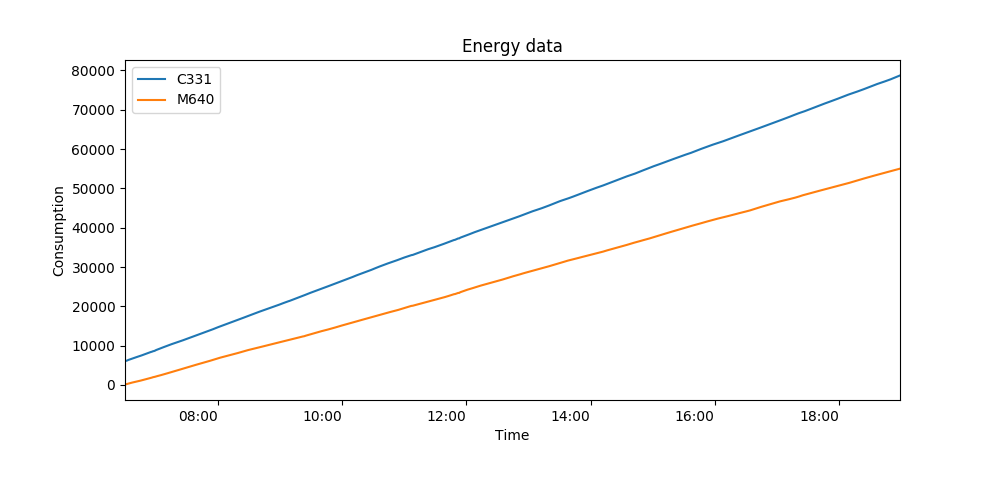
資料視覺化

data.plot()
plt.show()

使用 Python 分析 IoT 資料

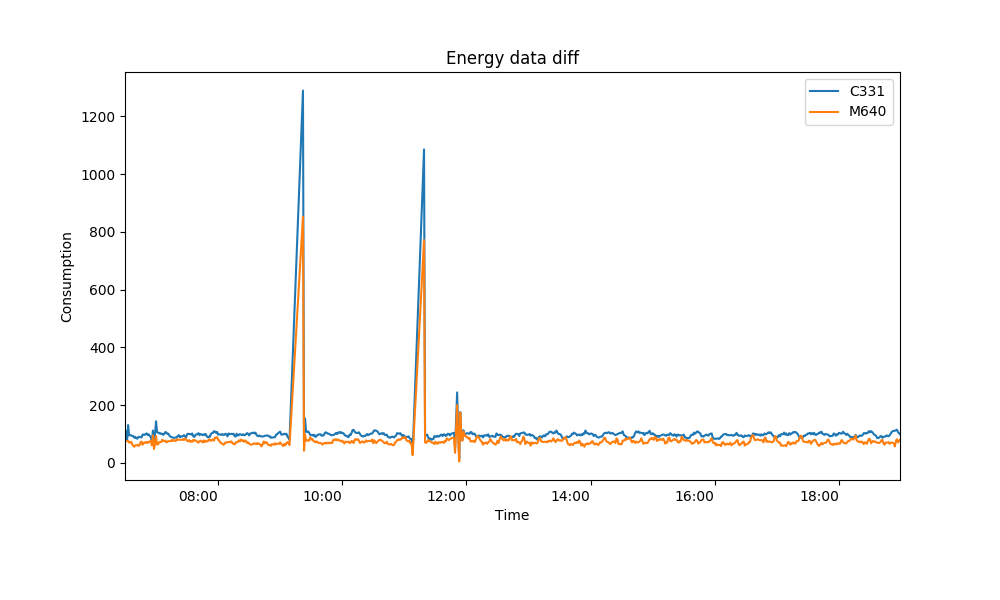
pd.diff()

# 差分
df_diff = data.diff(1)
df_diff.plot()
plt.show()
使用 Python 分析 IoT 資料

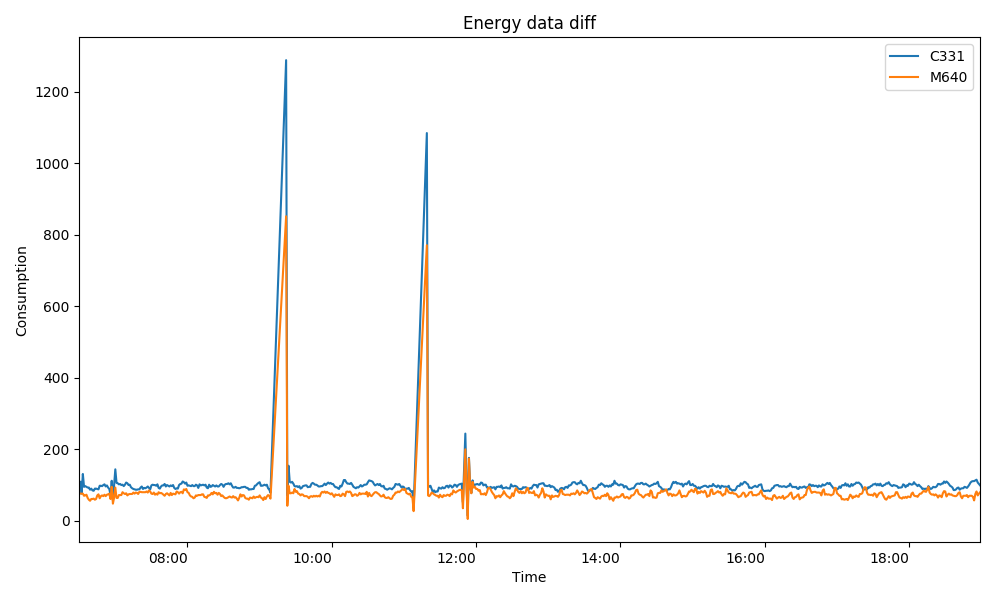
資料分析:差分

# 差分
df_diff = data.diff()
df_diff.plot()
plt.show()
 

# 重新取樣後的差分
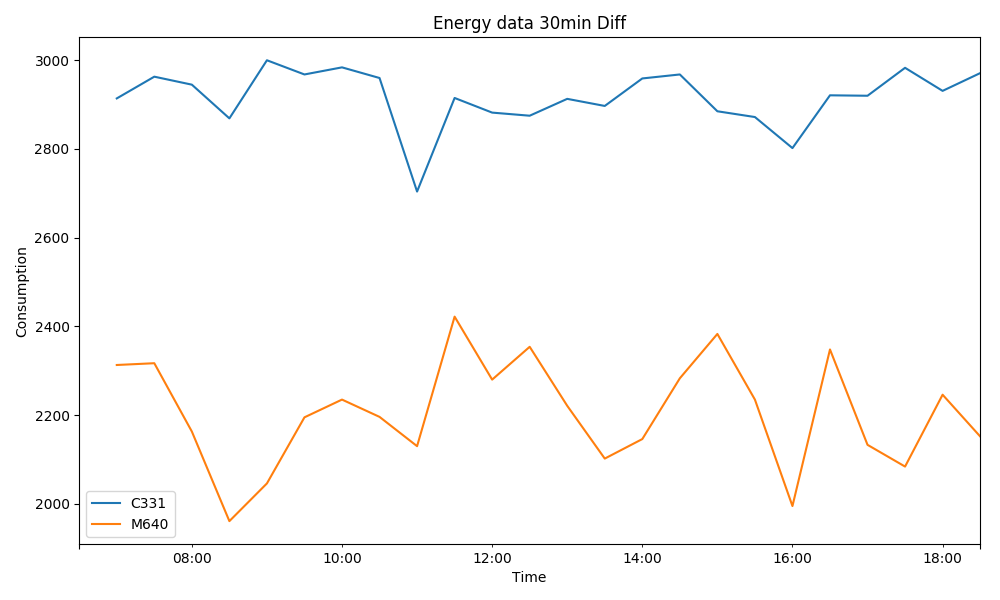
df = data.resample('30min').max()
df_diff = df.diff()
df_diff.plot()
plt.show()
使用 Python 分析 IoT 資料

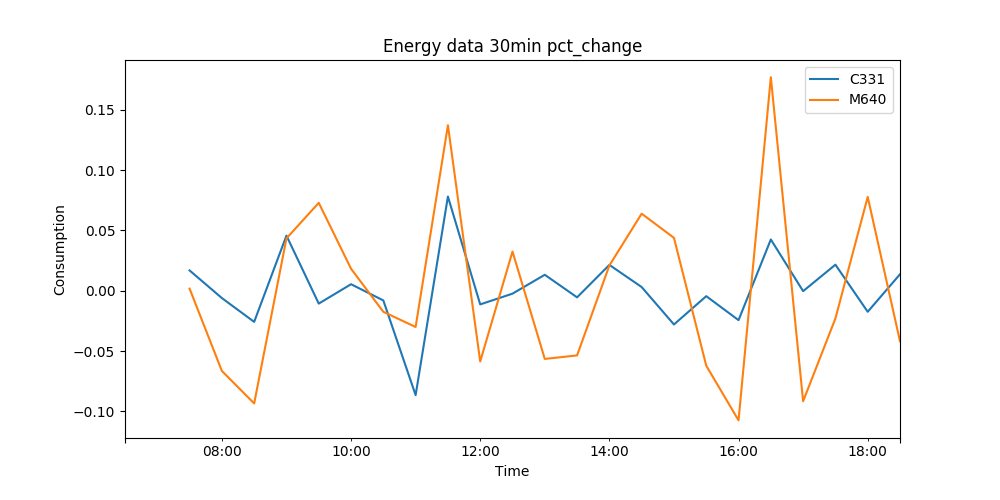
變動百分比

df_pct = df_diff.pct_change()
df_pct.plot()
使用 Python 分析 IoT 資料

一起來練習吧!

使用 Python 分析 IoT 資料

Preparing Video For Download...