季節性與趨勢

使用 Python 分析 IoT 資料

Matthias Voppichler

IT Developer

時間序列組成

  • 趨勢
  • 季節性
  • 殘差/雜訊
series[t] = trend[t] + seasonal[t] + residual[t]
20.2 = 14.9 + 4.39 + 0.91
使用 Python 分析 IoT 資料

季節性分解

import statsmodels.api as sm
# Run seasonal decompose
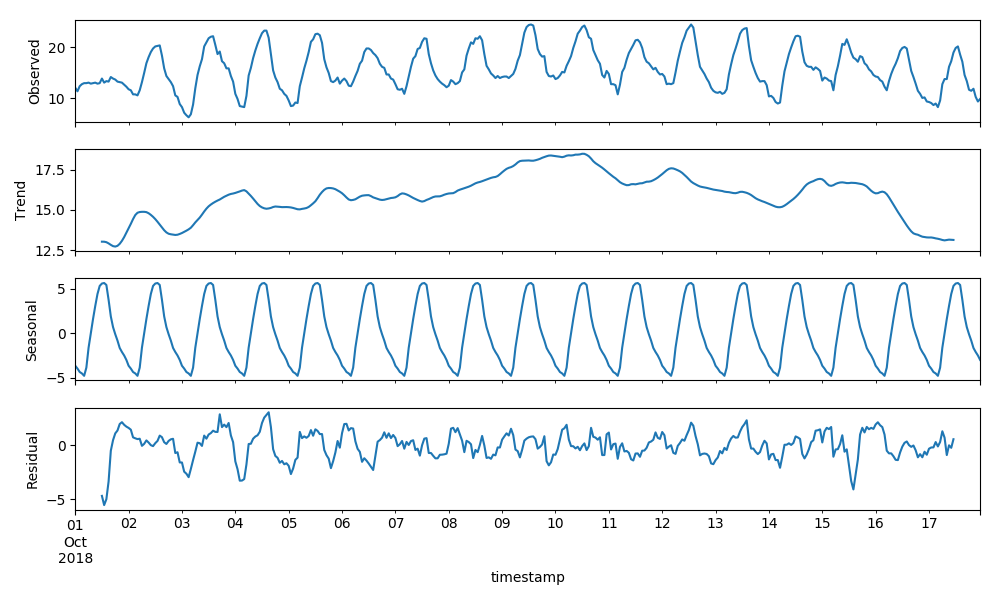
decomp = sm.tsa.seasonal_decompose(data["temperature"])
print(decomp.seasonal.head())

decomp.plot()
timestamp
2018-10-01 00:00:00   -3.670394
2018-10-01 01:00:00   -3.987451
2018-10-01 02:00:00   -4.372217
2018-10-01 03:00:00   -4.534066
2018-10-01 04:00:00   -4.802165
Freq: H, Name: temperature, dtype: float64
使用 Python 分析 IoT 資料

季節性分解

季節性分解圖

使用 Python 分析 IoT 資料

合併圖

# Plot the timeseries
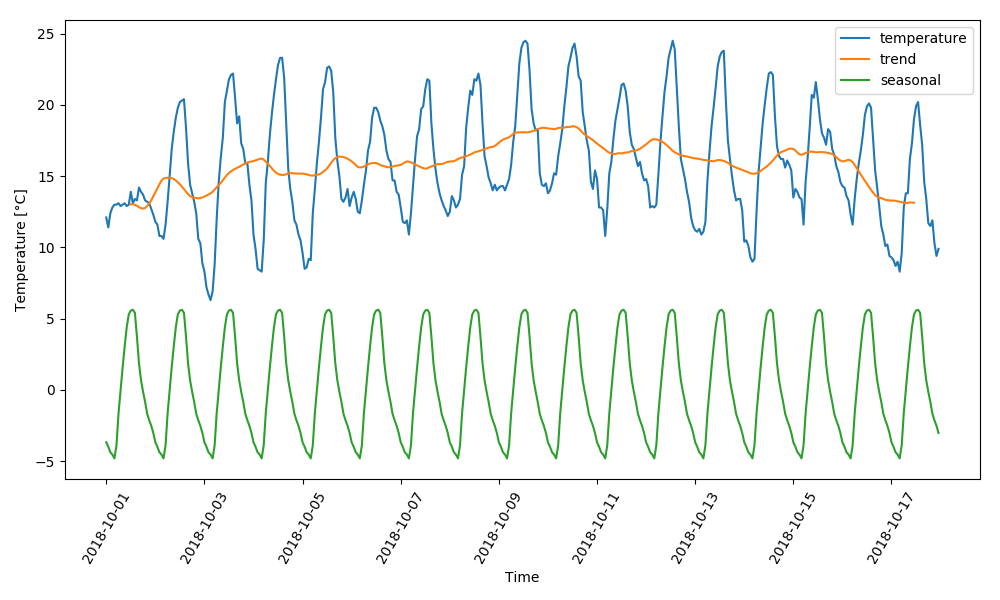
plt.plot(data["temperature"], label="temperature")

decomp = sm.tsa.seasonal_decompose(data["temperature"]) # Plot trend and seasonality plt.plot(decomp.trend, label="trend") plt.plot(decomp.seasonal, label="seasonal") plt.show()
使用 Python 分析 IoT 資料

合併圖

季節性分解-合併圖

使用 Python 分析 IoT 資料

一起來練習吧!

使用 Python 分析 IoT 資料

Preparing Video For Download...