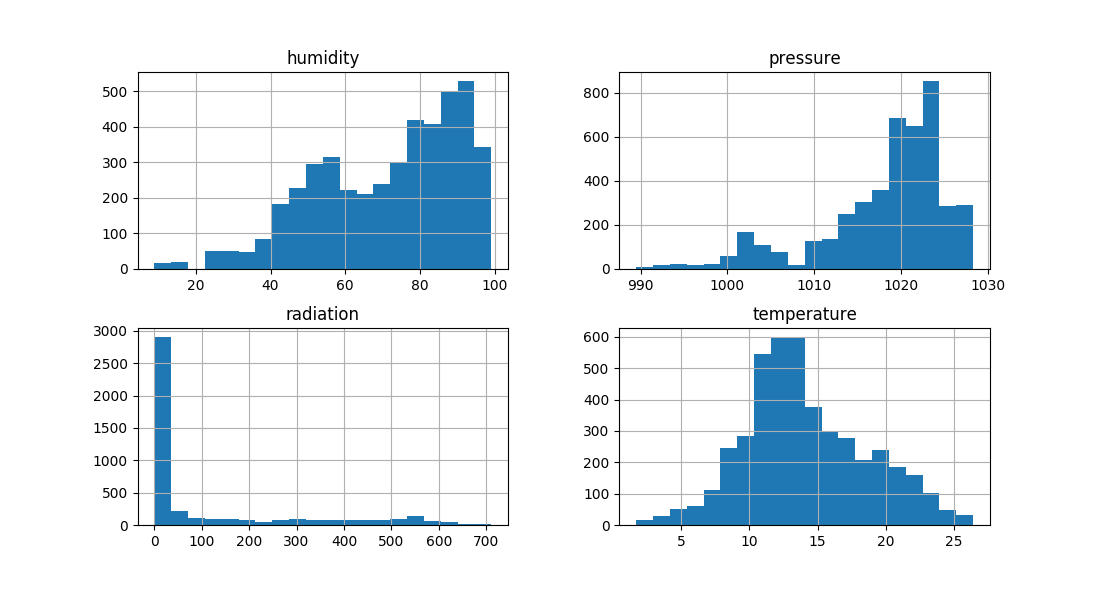
進行 EDA
使用 Python 分析 IoT 資料

Matthias Voppichler
IT Developer
繪製 DataFrame
df.plot(title="Environment")
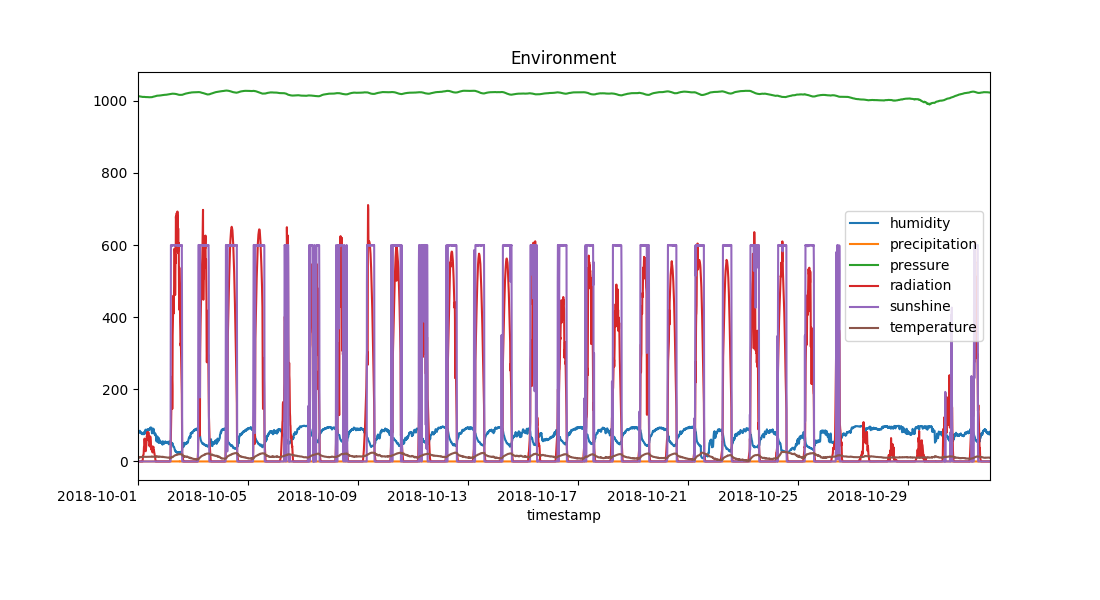
折線圖
df[["temperature", "humidity"]].plot(title="Environment")
plt.xlabel("Time")

次要 y 軸
plt.ylabel('Temperature')
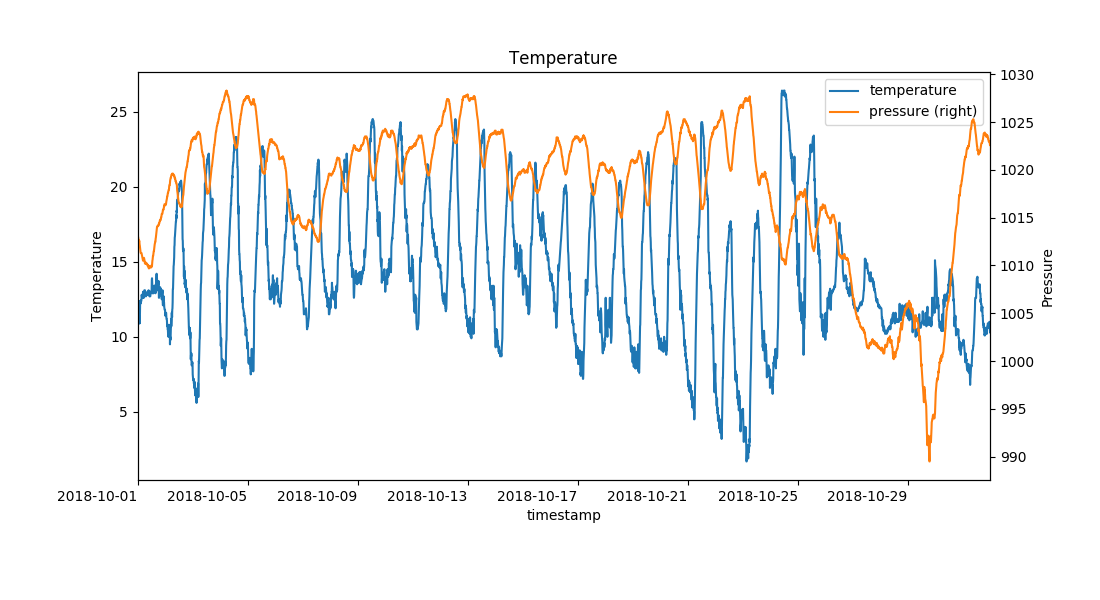
df[["temperature", "pressure"]].plot(title="Environment", secondary_y="pressure")
plt.ylabel('Pressure')
直方圖基礎
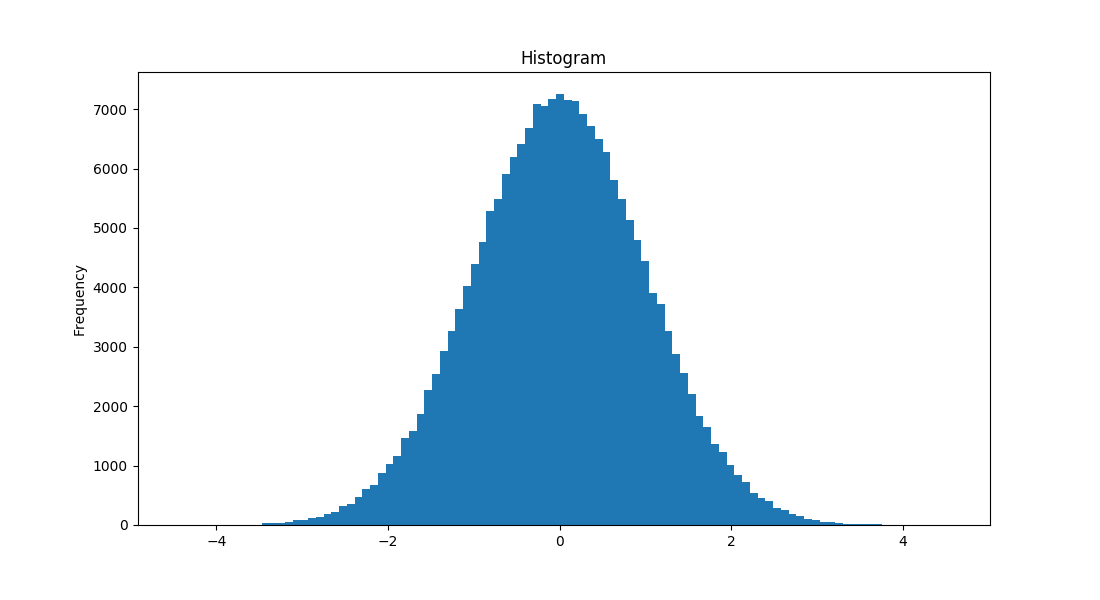
直方圖
df.hist(bins=20)