在 R 中分析問卷資料
Kelly McConville
Assistant Professor of Statistics
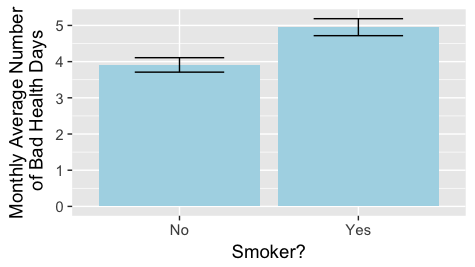
虛無假設:吸菸者與非吸菸者每月健康不佳天數的平均數相同。
對立假設:吸菸者與非吸菸者每月健康不佳天數的平均數不同。
檢定統計量:
$$ t = \frac{\bar{y}_s - \bar{y}_n}{SE} $$
svyttest(formula = DaysPhysHlthBad ~ SmokeNow,
         design = NHANES_design)
Design-based t-test
data:  DaysPhysHlthBad ~ SmokeNow
t = 3.8208, df = 32, p-value = 0.0005778
alternative hypothesis: true difference in mean is not equal to 0
sample estimates:
difference in mean
          1.042766