以線性迴歸建模

在 R 中分析問卷資料

Kelly McConville

Assistant Professor of Statistics

迴歸線

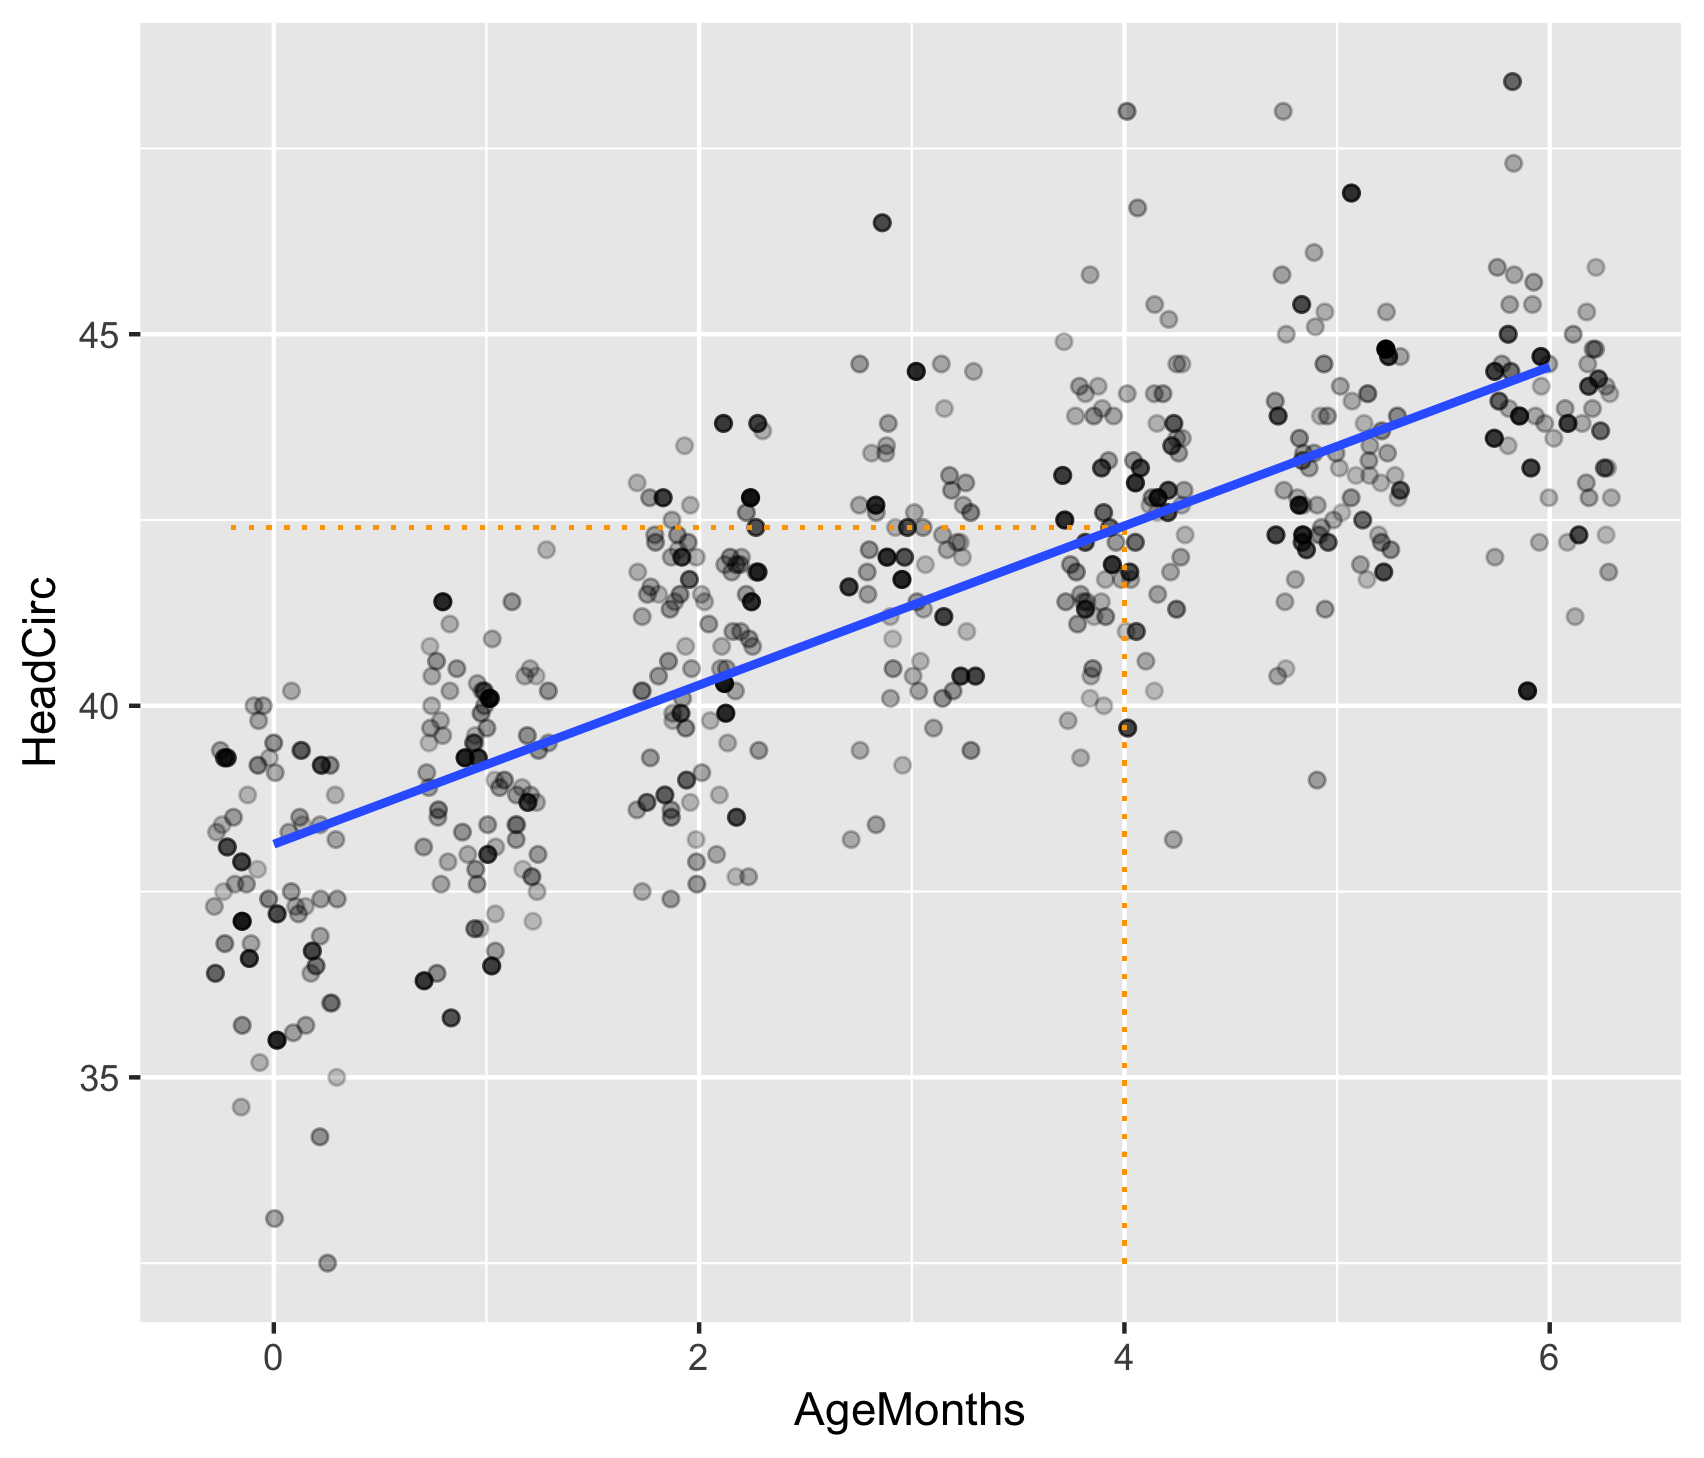
年齡對頭圍的散佈圖與趨勢線,透明度代表體重

在 R 中分析問卷資料

迴歸線

年齡對頭圍的散佈圖與趨勢線,透明度代表體重。橘色虛線輔助預測年齡為 4 個月時的值。

在 R 中分析問卷資料

迴歸方程式

  • 迴歸方程式為:

$$\hat{y} = a + b x$$

  • 透過最小化求得 $a$ 與 $b$:

$$\sum_{i=1}^n w_i (y_i -\hat{y}_i)^2$$

在 R 中分析問卷資料

擬合迴歸模型

mod <- svyglm(HeadCirc ~ AgeMonths, design = NHANES_design)
summary(mod)
svyglm(formula = HeadCirc ~ AgeMonths, design = NHANES_design)

Survey design:
svydesign(data = NHANESraw, strata = ~SDMVSTRA, id = ~SDMVPSU, 
    nest = TRUE, weights = ~WTMEC4YR)

Coefficients:
            Estimate Std. Error t value Pr(>|t|)    
(Intercept)  38.1376     0.2004   190.3   <2e-16 ***
AgeMonths     1.0708     0.0593    18.1   <2e-16 ***
(Some output omitted)
在 R 中分析問卷資料

線性迴歸推論

  • 「估計」的迴歸方程式:

$$\hat{y} = a + b x$$

  • 「真實」的迴歸方程式:

$$E(y) = A + B x$$

  • $E(y)$ 為 $y$ 的平均值,變異為 sd$(y) = \sigma$。
在 R 中分析問卷資料

線性迴歸推論

虛無假設:頭圍與年齡不存在線性關係(即 $B = 0$)。

對立假設:頭圍與年齡存在線性關係(即 $B \neq 0$)。

mod <- svyglm(HeadCirc ~ AgeMonths, design = NHANES_design)
summary(mod)
Coefficients:
            Estimate Std. Error t value Pr(>|t|)    
(Intercept)  38.1376     0.2004   190.3   <2e-16 ***
AgeMonths     1.0708     0.0593    18.1   <2e-16 ***
(Some Output Omitted)

檢定統計量:$t = \frac{b}{SE}$

在 R 中分析問卷資料

一起來練習吧!

在 R 中分析問卷資料

Preparing Video For Download...