繪製迴歸模型

Generalized Linear Models in Python

Ita Cirovic Donev

Data Science Consultant

匯入函式庫

import seaborn as sns
import matplotlib.pyplot as plt
  • 螃蟹模型 'sat ~ width' 已存為 model
Generalized Linear Models in Python

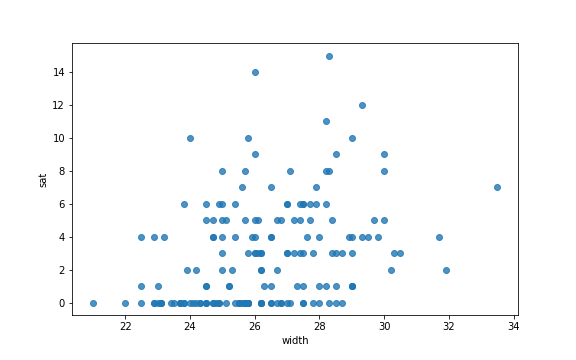
繪製資料點

# Adjust figure size
plt.subplots(figsize = (8, 5))
# Plot data points
sns.regplot('width', 'sat', 
            data = crab,
            fit_reg = False)

螃蟹資料集中 width 與衛星數的散佈圖。

Generalized Linear Models in Python

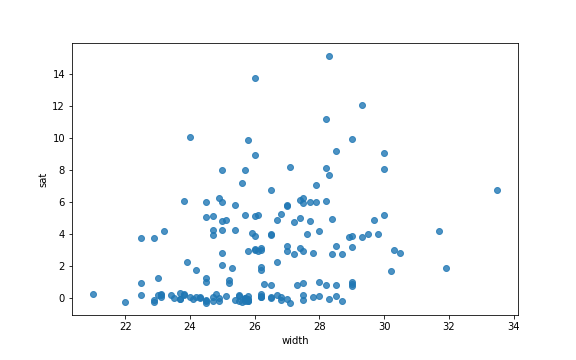
加入抖動(jitter)

sns.regplot('width', 'sat', 
            data = crab,
            fit_reg = False,
            y_jitter = 0.3)

在螃蟹資料集中對 width 與衛星數的散佈圖加入抖動。

Generalized Linear Models in Python

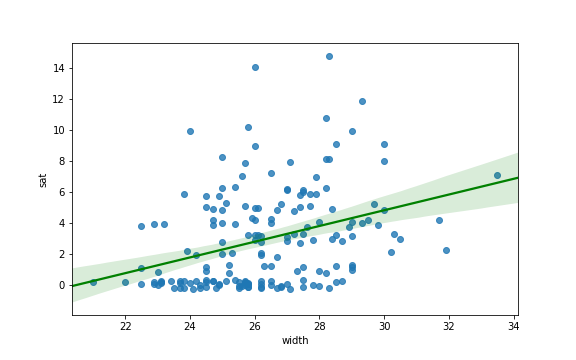
加入線性擬合

sns.regplot('width', 'sat', 
            data = crab,
            y_jitter = 0.3,
            fit_reg = True,
            line_kws = {'color':'green', 
                        'label':'LM fit'})

螃蟹資料集中 width 與衛星數的散佈圖,含線性擬合與信賴區間。

Generalized Linear Models in Python

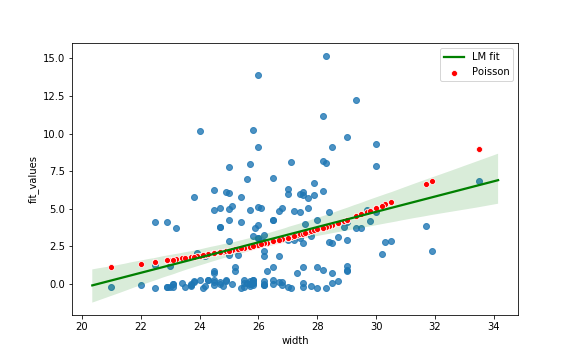
加入 Poisson GLM 預估值

crab['fit_values'] = model.fittedvalues
sns.scatterplot('width','fit_values', 
                data = crab,
                color = 'red', 
                label = 'Poisson')

螃蟹資料集中 width 與衛星數的散佈圖,含線性與 Poisson 擬合。

Generalized Linear Models in Python

預測值

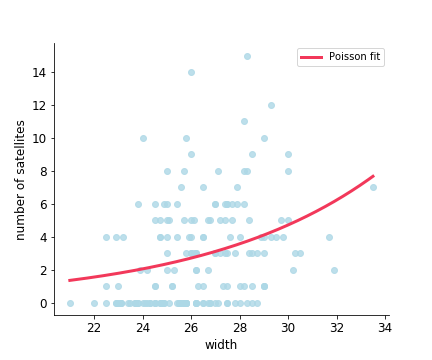
Poisson 模型擬合覆蓋在 width 與衛星數的散佈圖上

Generalized Linear Models in Python

預測值

new_data = pd.DataFrame({'width':[24, 28, 32]})
model.predict(new_data)
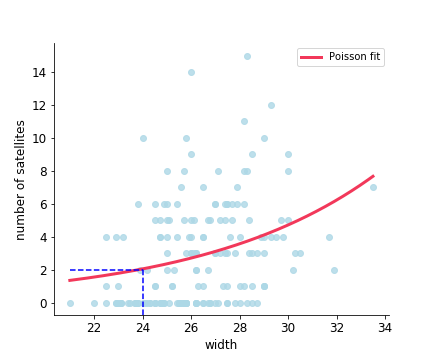
0    1.881981

在擬合的 Poisson 迴歸模型下,讀取 width 為 24cm 的預測值。

Generalized Linear Models in Python

預測值

new_data = pd.DataFrame({'width':[24, 28, 32]})
model.predict(new_data)
0    1.881981
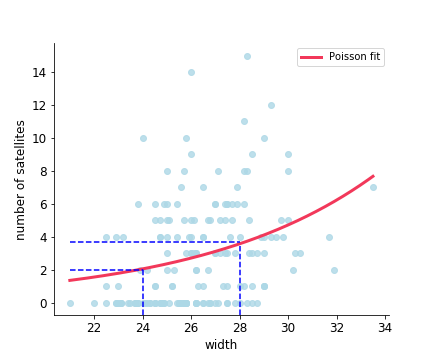
1    3.627360

在擬合的 Poisson 迴歸模型下,讀取 width 為 28cm 的預測值。

Generalized Linear Models in Python

預測值

new_data = pd.DataFrame({'width':[24, 28, 32]})
model.predict(new_data)
0    1.881981
1    3.627360
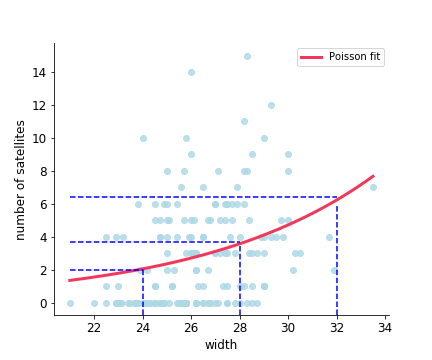
2    6.991433

在擬合的 Poisson 迴歸模型下,讀取 width 為 32cm 的預測值。

Generalized Linear Models in Python

一起來練習吧!

Generalized Linear Models in Python

Preparing Video For Download...