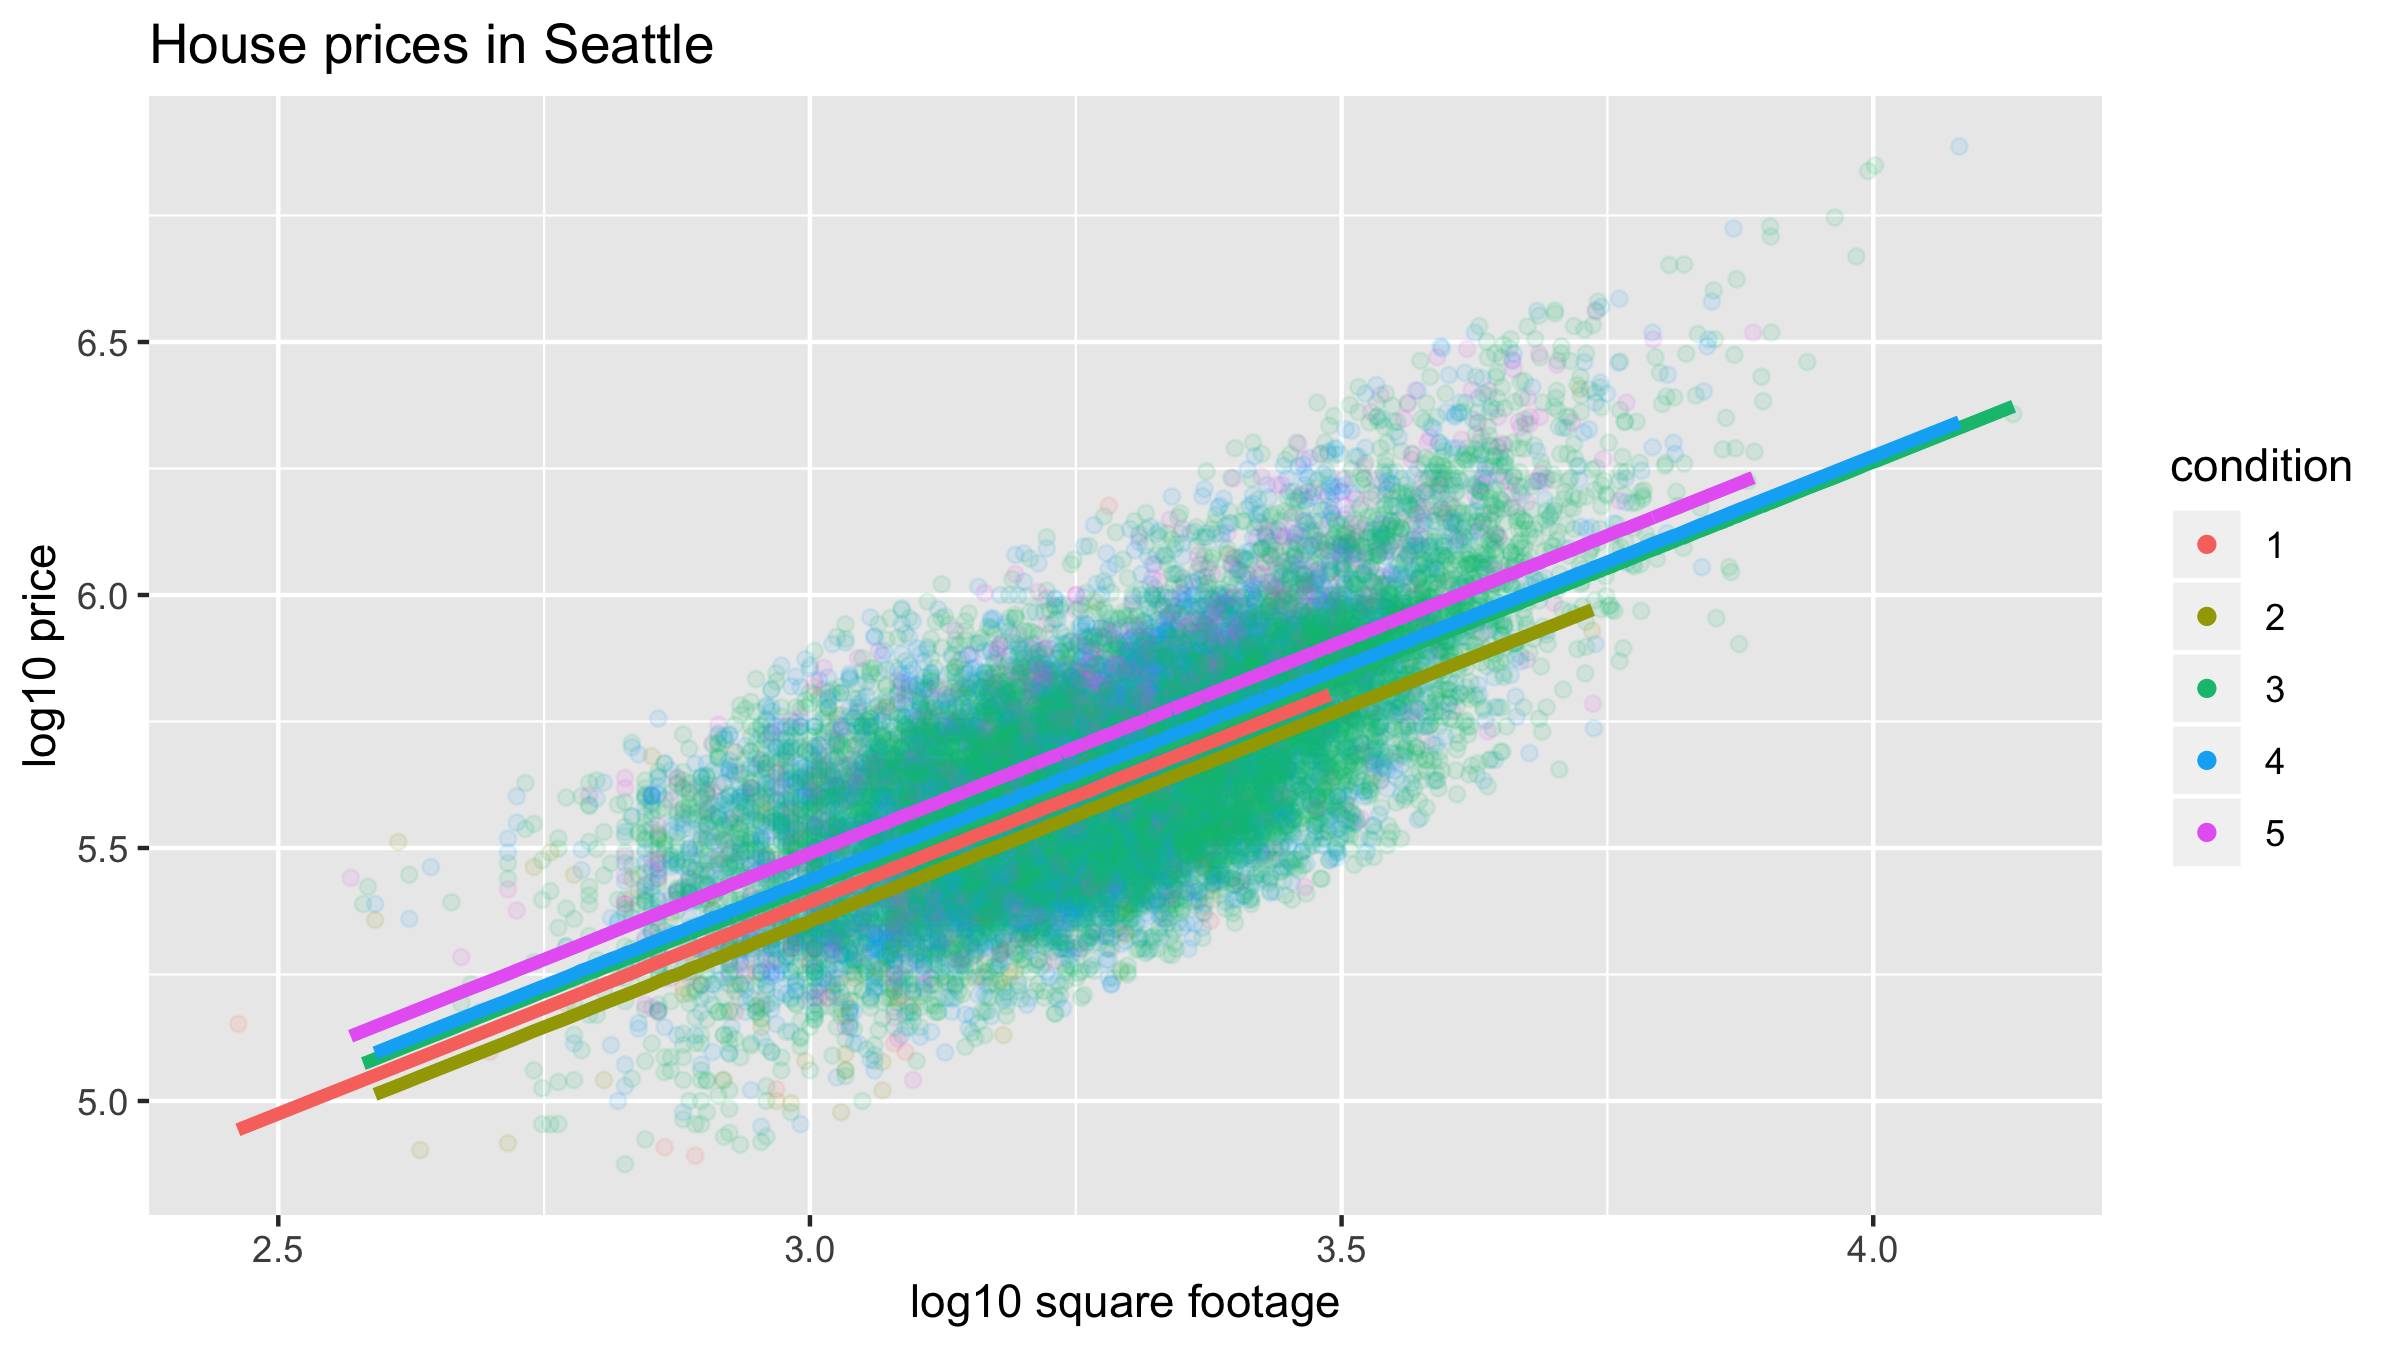
# Fit regression model and get regression table
model_price_3 <- lm(log10_price ~ log10_size + condition,
                    data = house_prices)
get_regression_table(model_price_3)
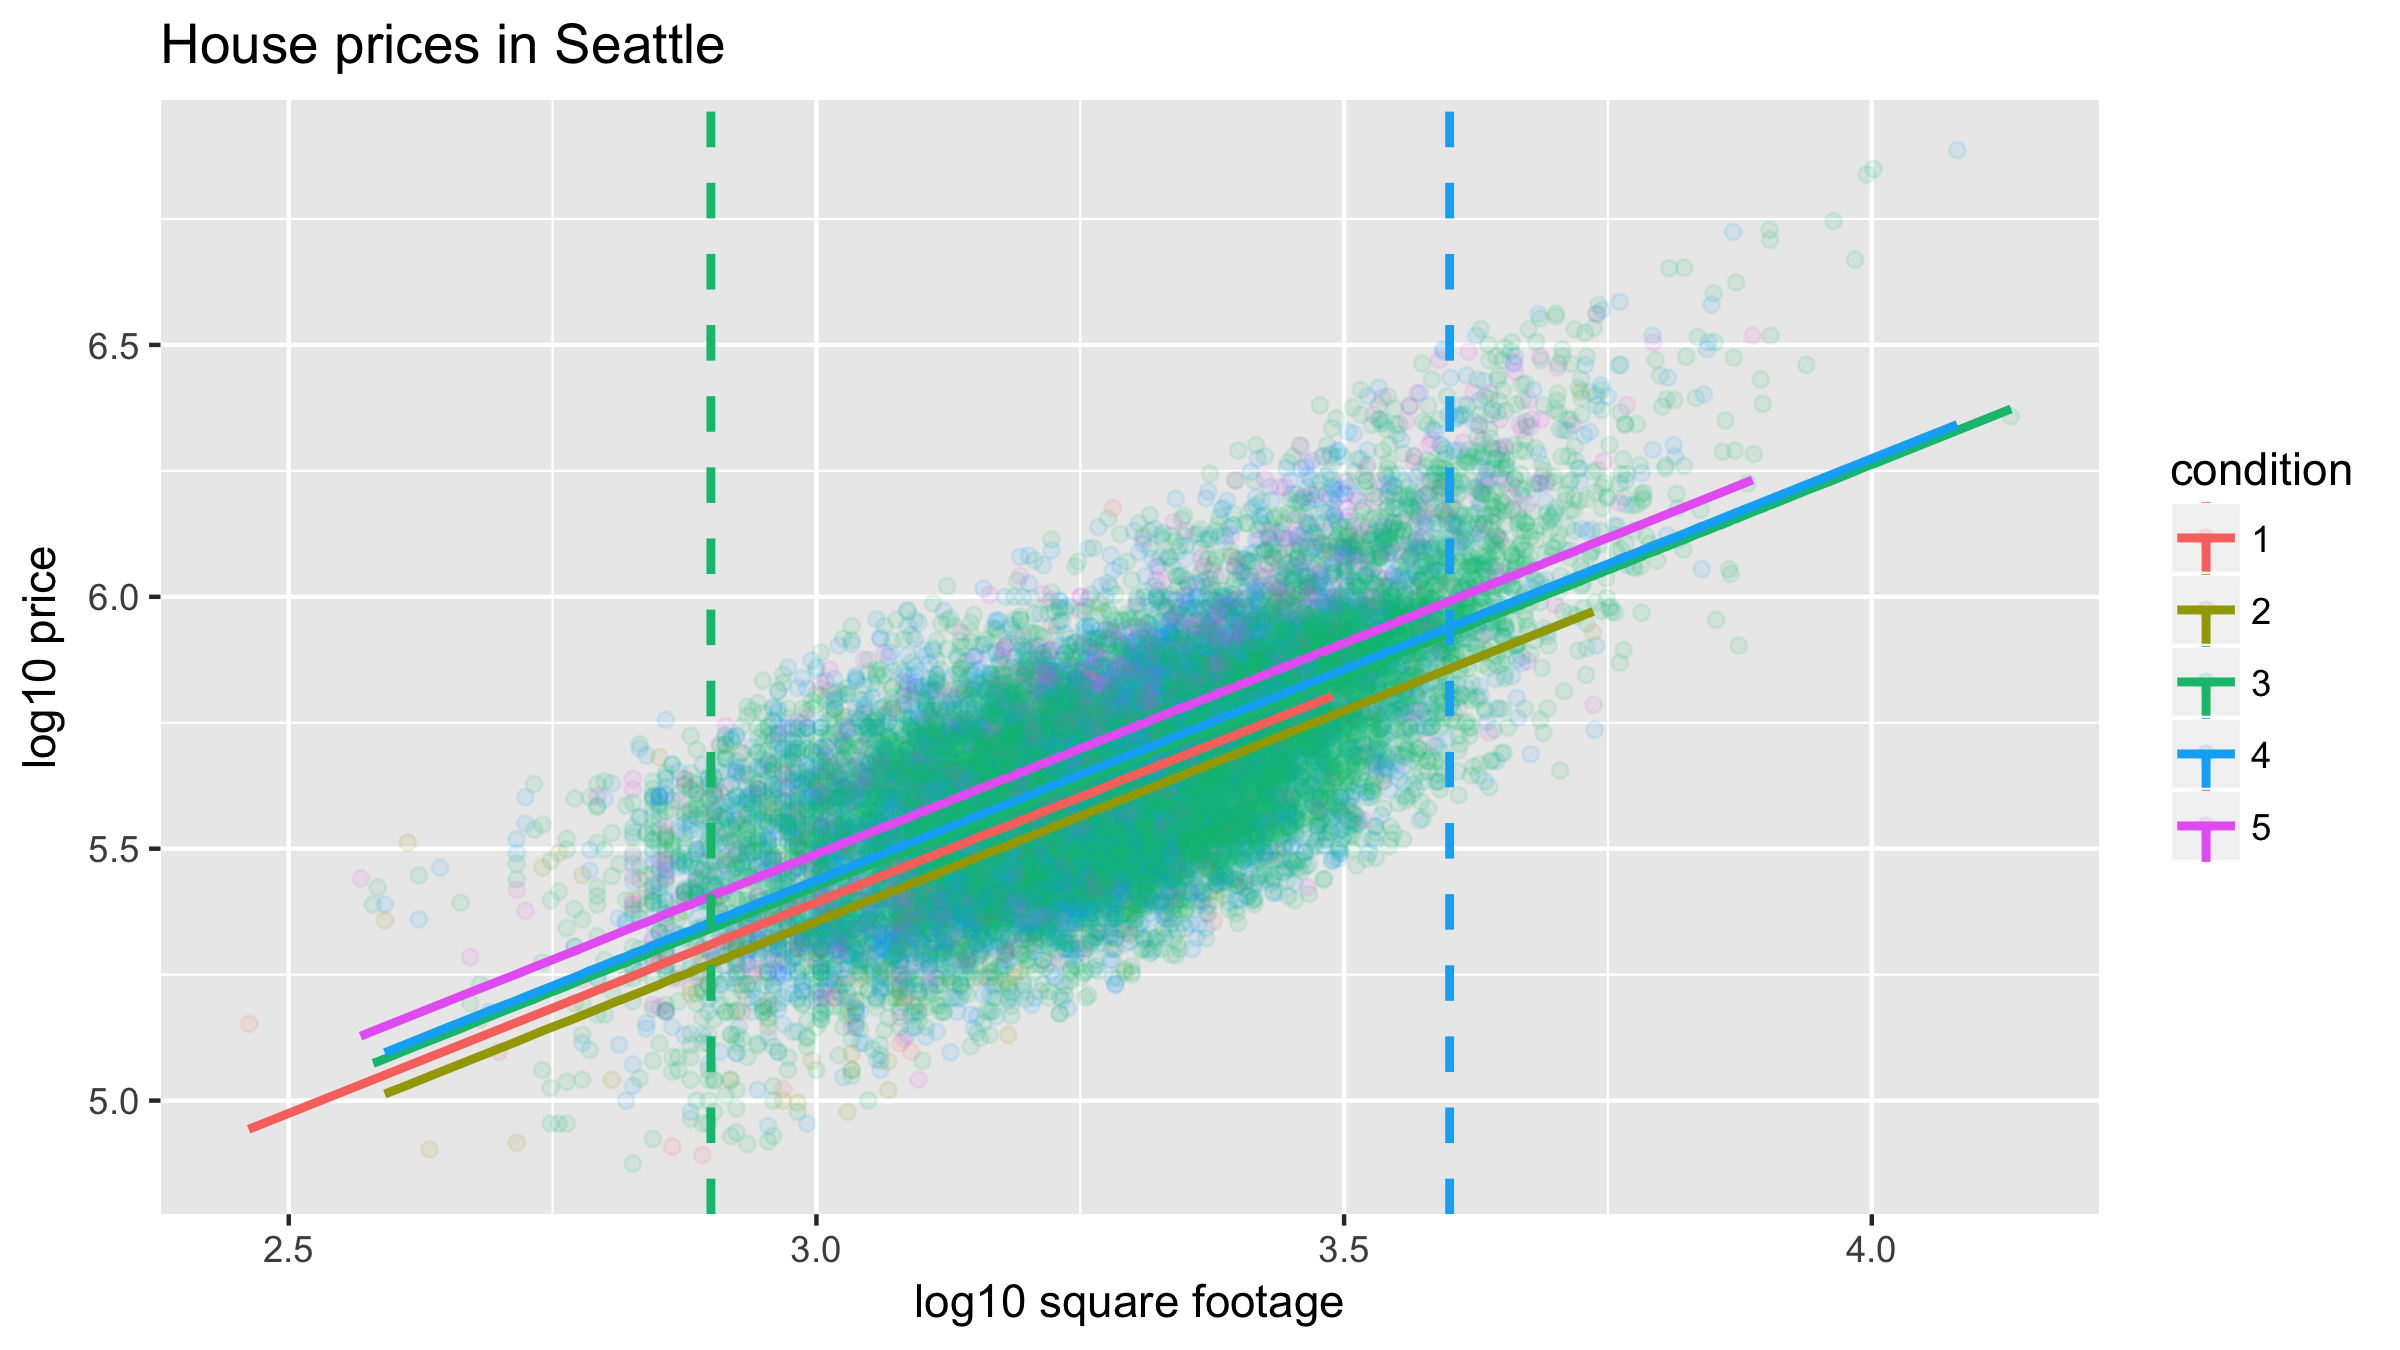
# Create data frame of "new" houses
new_houses <- data_frame(
  log10_size = c(2.9, 3.6),
  condition = factor(c(3, 4))
)
new_houses
# A tibble: 2 x 2
  log10_size condition
       <dbl> <fct>
1        2.9 3
2        3.6 4
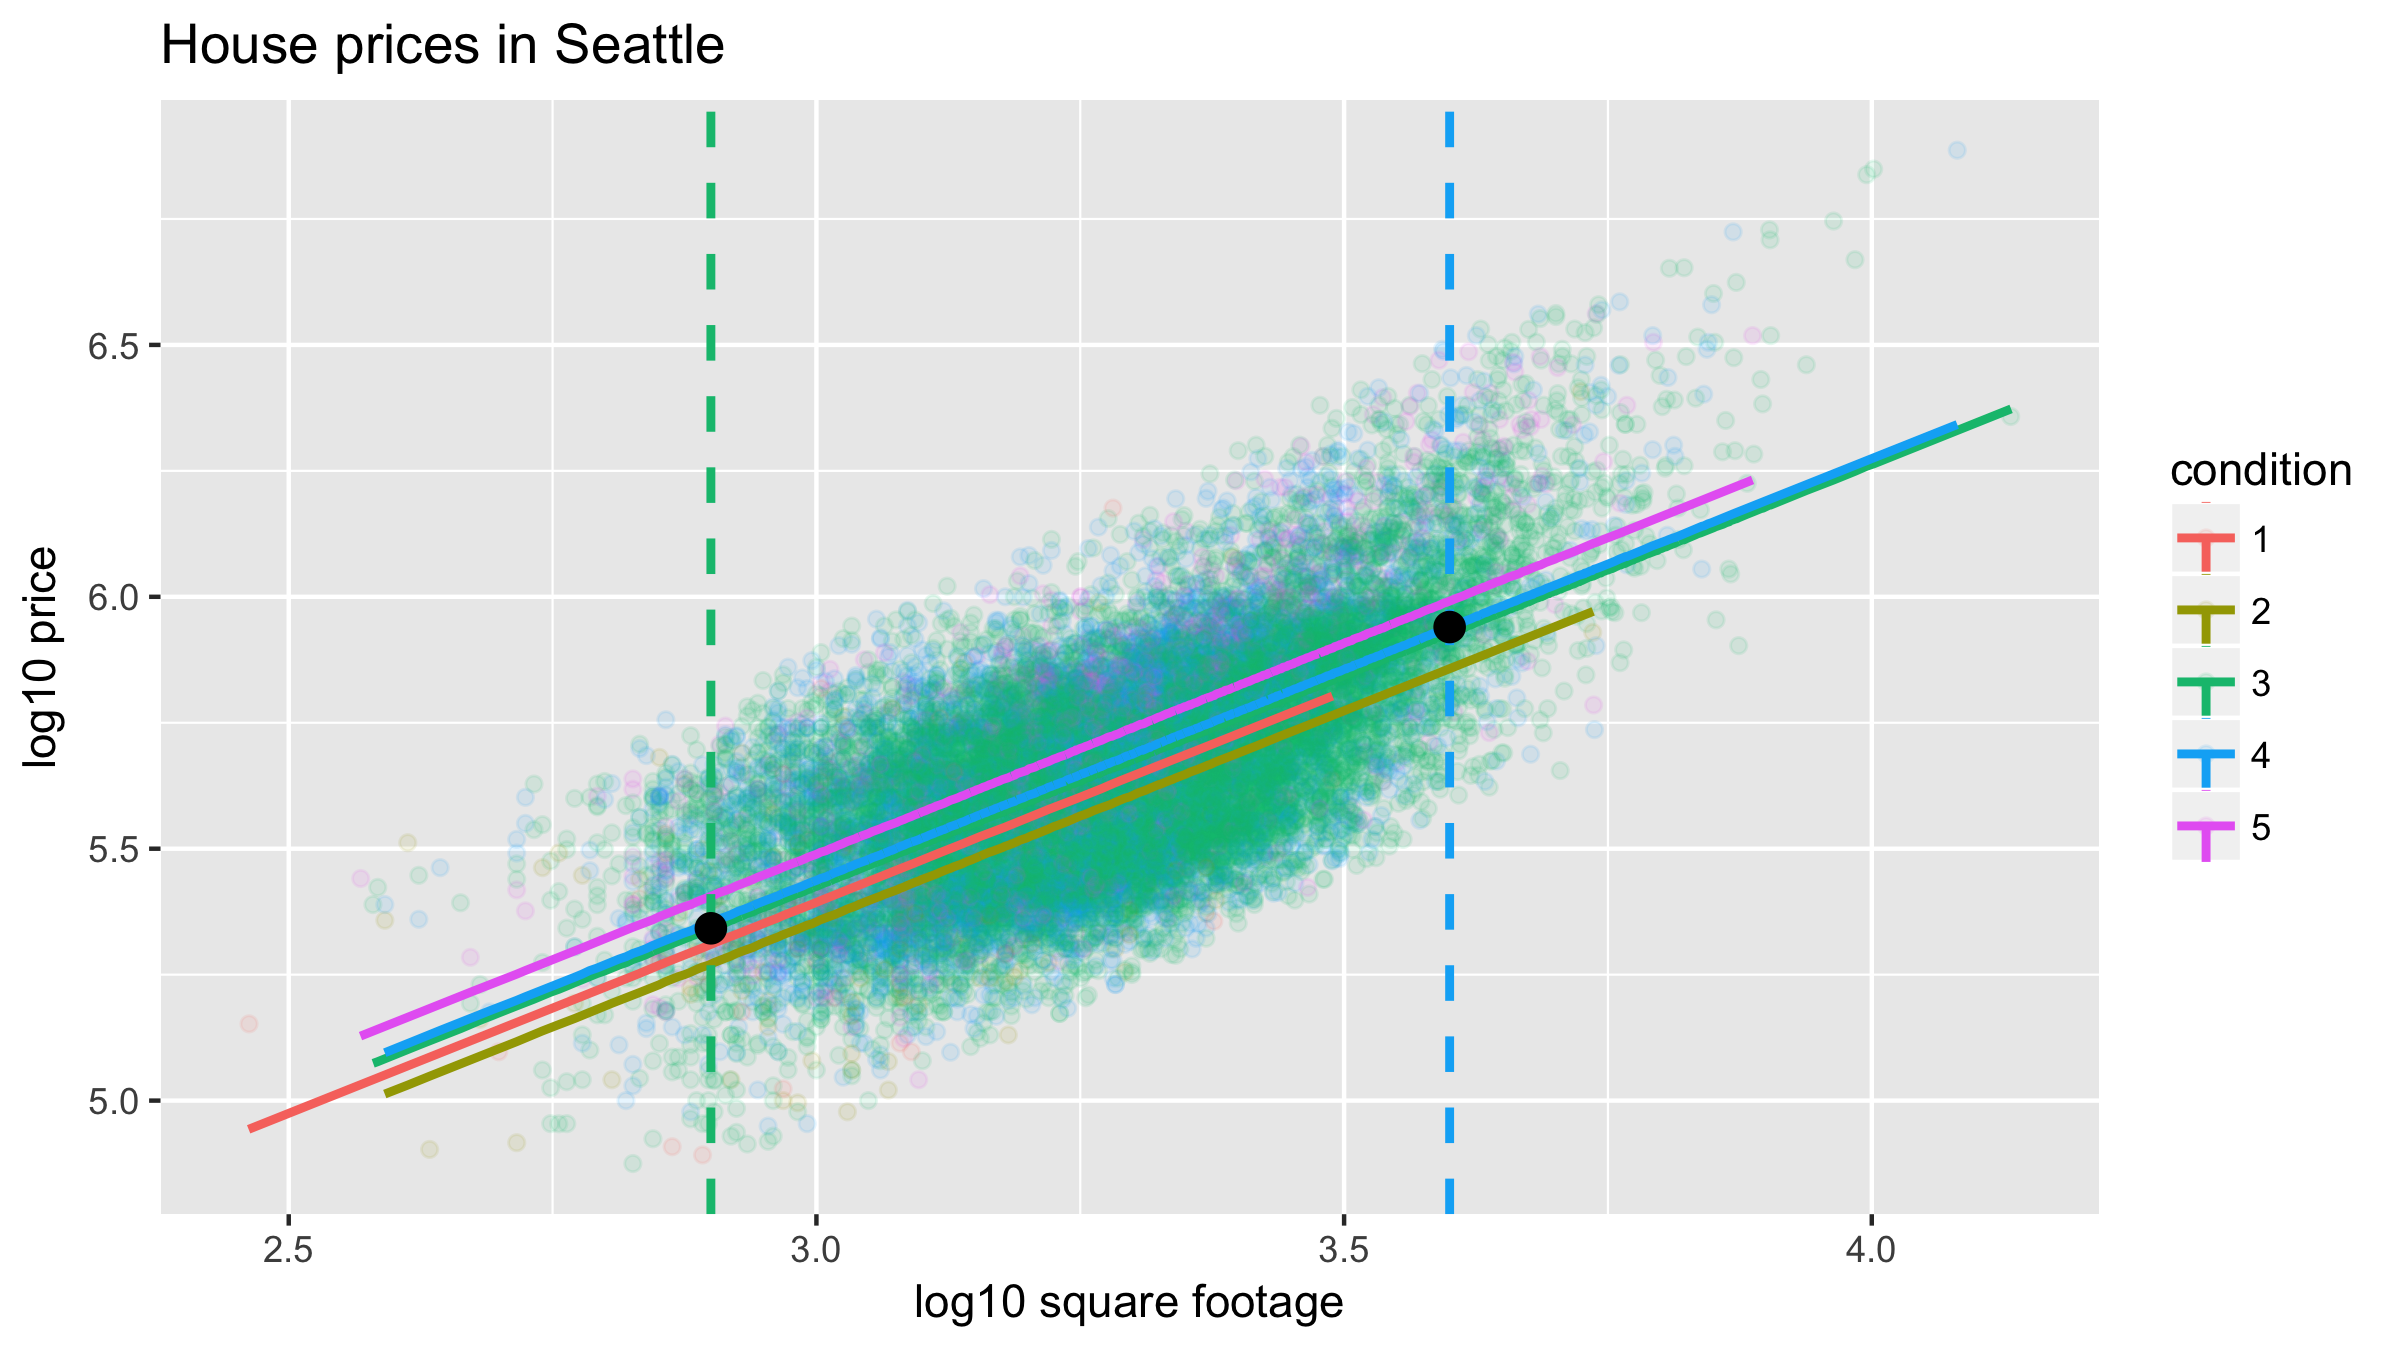
用新資料做預測
# Make predictions on new data
get_regression_points(model_price_3,
                      newdata = new_houses)
# A tibble: 2 x 4
     ID log10_size condition log10_price_hat
  <int>      <dbl> <fct>               <dbl>
1     1        2.9 3                    5.34
2     2        3.6 4                    5.94
用新資料做預測
# Make predictions in original units by undoing log10()
get_regression_points(model_price_3,
                      newdata = new_houses) %>%
  mutate(price_hat = 10^log10_price_hat)
# A tibble: 2 x 5
     ID log10_size condition log10_price_hat price_hat
  <int>      <dbl> <fct>               <dbl>     <dbl>
1     1        2.9 3                    5.34   219786.
2     2        3.6 4                    5.94   870964.