map 系列函式

Tidyverse 的 Machine Learning

Dmitriy (Dima) Gorenshteyn

Lead Data Scientist, Memorial Sloan Kettering Cancer Center

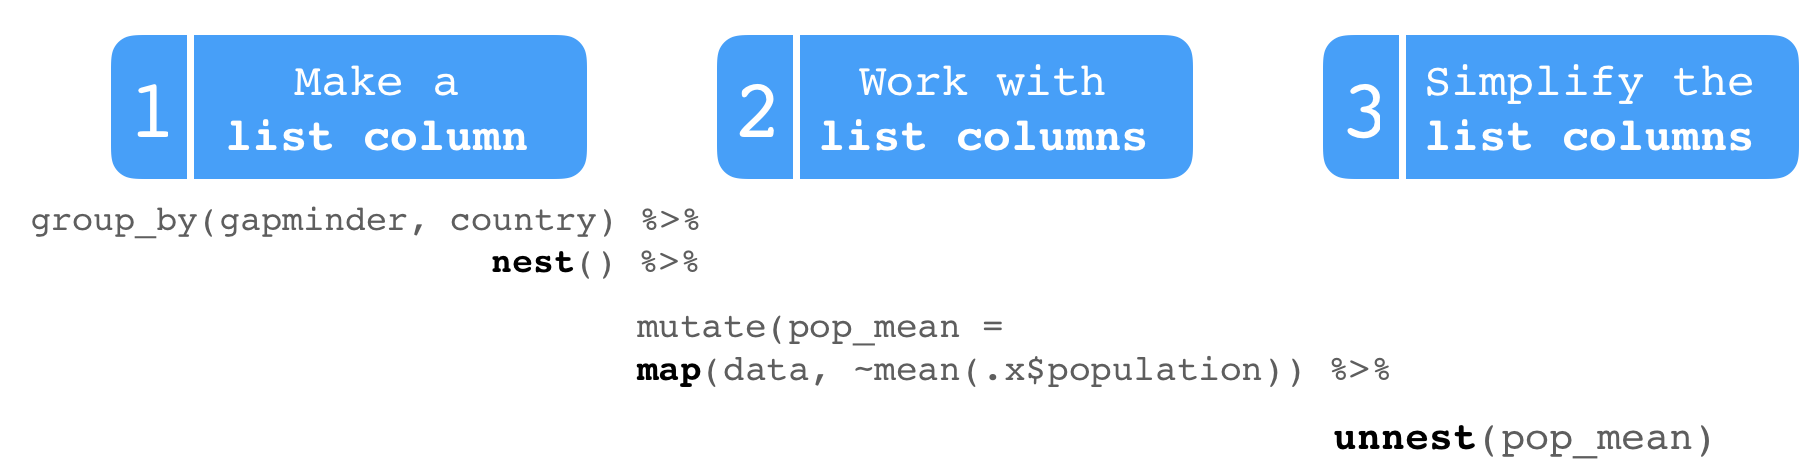
清單欄位流程

Tidyverse 的 Machine Learning

清單欄位流程

Tidyverse 的 Machine Learning

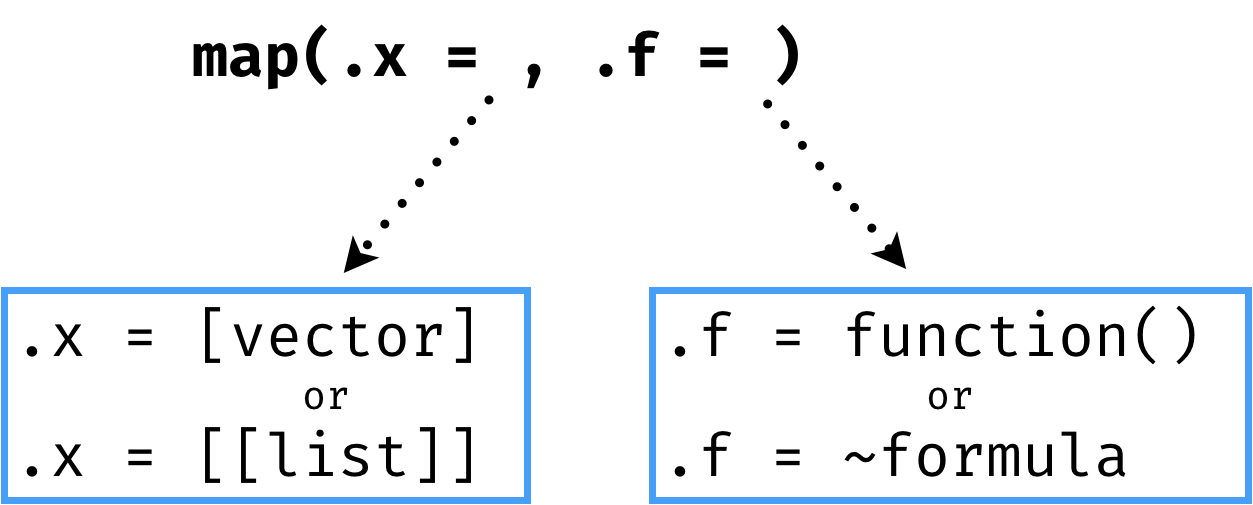
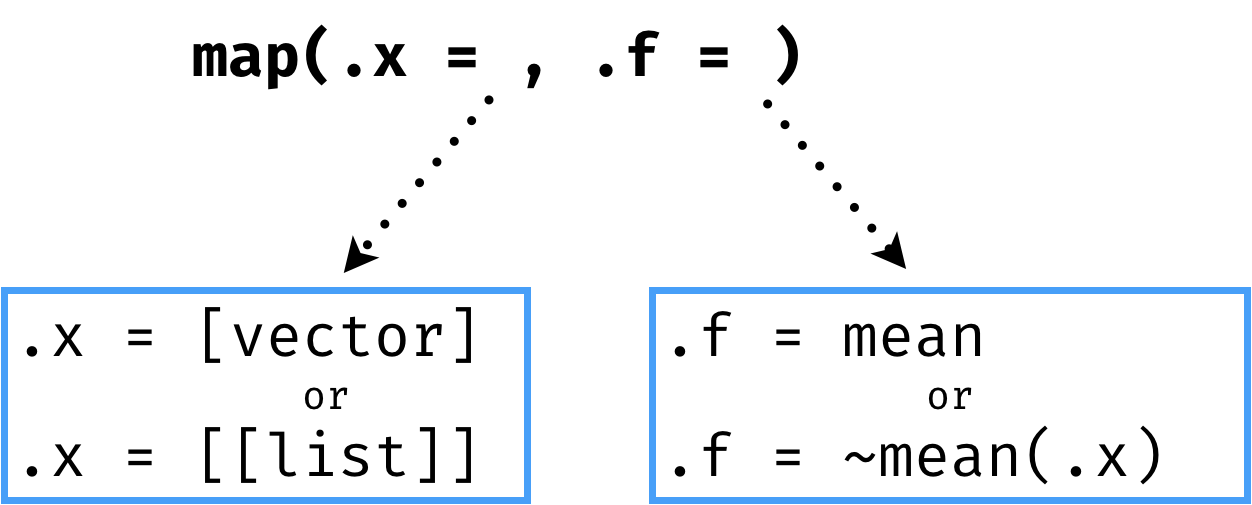
map 函式

Tidyverse 的 Machine Learning

map 函式

Tidyverse 的 Machine Learning

map 函式

Tidyverse 的 Machine Learning

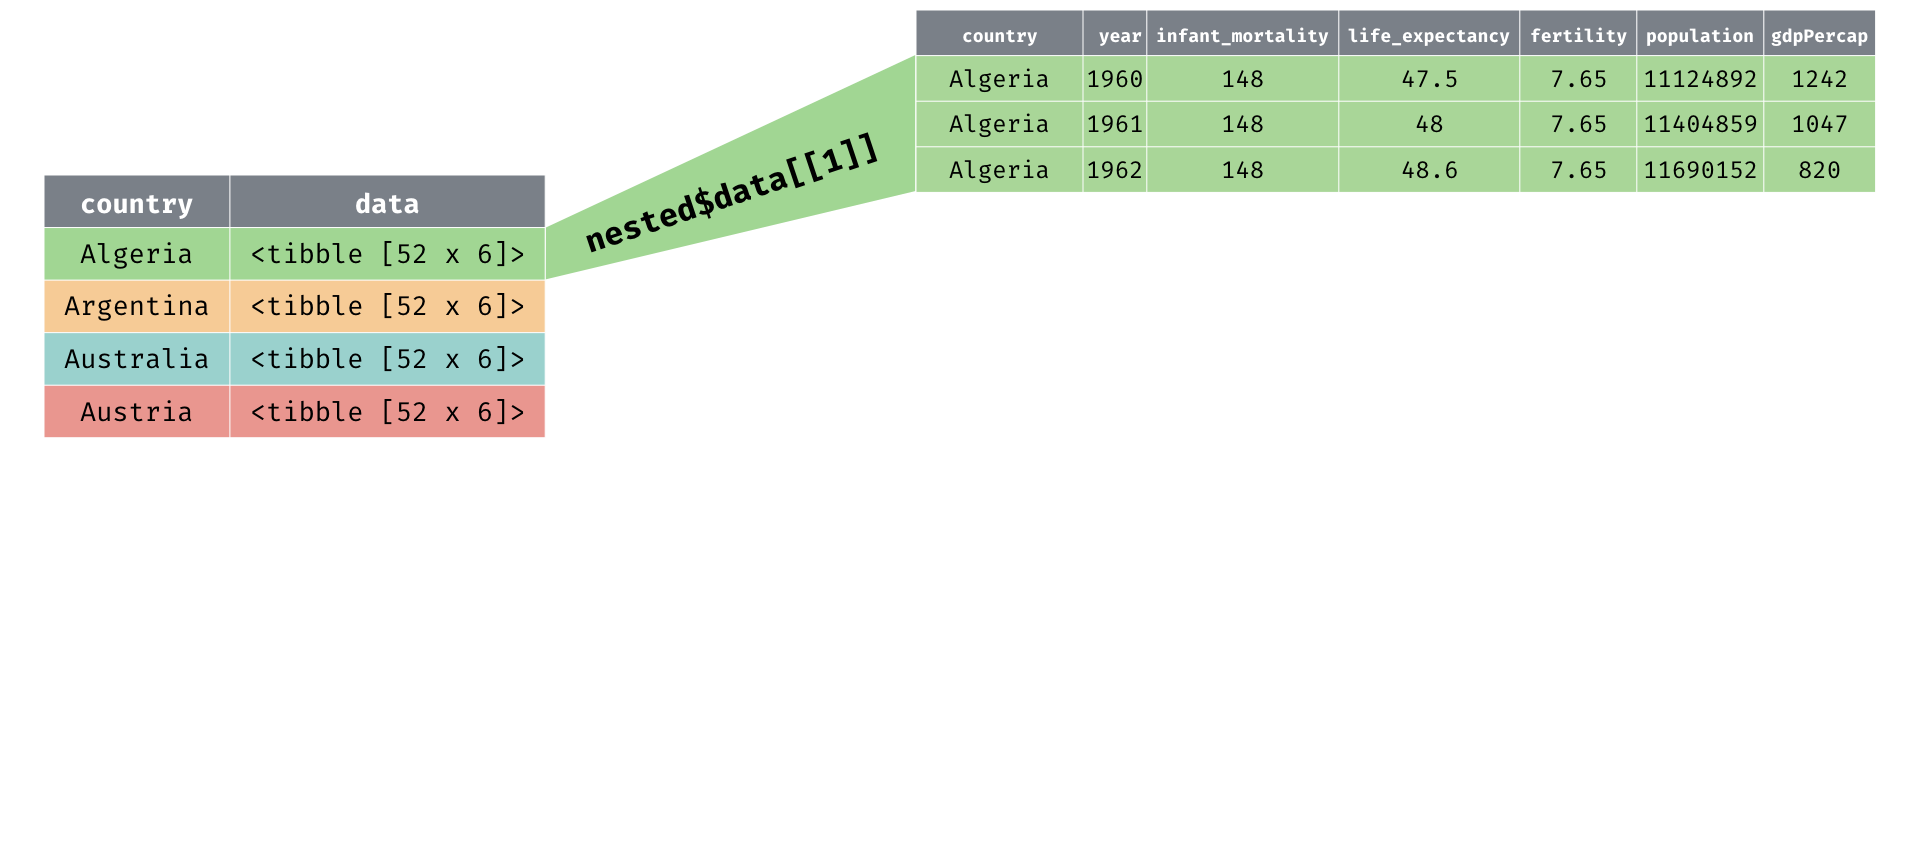
各國人口平均數

mean(nested$data[[1]]$population)
[1] 23129438
Tidyverse 的 Machine Learning

各國人口平均數

map(.x = nested$data, .f = ~mean(.x$population))
[[1]]
[1] 23129438

[[2]]
[1] 30783053

[[3]]
[1] 16074837

[[4]]
[1] 7746272
Tidyverse 的 Machine Learning

2:操作清單欄位-map() 與 mutate()

pop_df <- nested %>% 
  mutate(pop_mean = map(data, ~mean(.x$population)))

pop_df
# A tibble: 77 x 3
   country    data              pop_mean 
   <fct>      <list>            <list>   
 1 Algeria    <tibble [52 × 6]> <dbl [1]>
 2 Argentina  <tibble [52 × 6]> <dbl [1]>
 3 Australia  <tibble [52 × 6]> <dbl [1]>
 4 Austria    <tibble [52 × 6]> <dbl [1]>
 5 Bangladesh <tibble [52 × 6]> <dbl [1]>
Tidyverse 的 Machine Learning

3:簡化清單欄位-unnest()

pop_df %>% 
  unnest(pop_mean)
# A tibble: 77 x 3
   country    data               pop_mean
   <fct>      <list>                <dbl>
 1 Algeria    <tibble [52 × 6]>  23129438
 2 Argentina  <tibble [52 × 6]>  30783053
 3 Australia  <tibble [52 × 6]>  16074837
 4 Austria    <tibble [52 × 6]>   7746272
 5 Bangladesh <tibble [52 × 6]>  97649407
Tidyverse 的 Machine Learning

清單欄位流程

Tidyverse 的 Machine Learning

用 map_*() 操作並簡化清單欄位

function returns
map() list
map_dbl() double
map_lgl() logical
map_chr() character
map_int() integer
Tidyverse 的 Machine Learning

用 map_dbl() 操作並簡化清單欄位

nested %>% 
  mutate(pop_mean = map_dbl(data, ~mean(.x$population)))
# A tibble: 77 x 3
   country    data               pop_mean
   <fct>      <list>                <dbl>
 1 Algeria    <tibble [52 × 6]>  23129438
 2 Argentina  <tibble [52 × 6]>  30783053
 3 Australia  <tibble [52 × 6]>  16074837
 4 Austria    <tibble [52 × 6]>   7746272
 5 Bangladesh <tibble [52 × 6]>  97649407
Tidyverse 的 Machine Learning

用 map() 建立模型

nested %>%
   mutate(model = map(data, ~lm(formula = population~fertility, 
             data = .x)))
# A tibble: 77 x 3
   country    data              model   
   <fct>      <list>            <list>  
 1 Algeria    <tibble [52 × 6]> <S3: lm>
 2 Argentina  <tibble [52 × 6]> <S3: lm>
 3 Australia  <tibble [52 × 6]> <S3: lm>
 4 Austria    <tibble [52 × 6]> <S3: lm>
 5 Bangladesh <tibble [52 × 6]> <S3: lm>
Tidyverse 的 Machine Learning

Let's map something!

Tidyverse 的 Machine Learning

Preparing Video For Download...