一天中的時間會影響逮捕率嗎?

使用 pandas 分析警方執法活動

Kevin Markham

Founder, Data School

分析 datetime 資料

apple
    price    volume       date_and_time
0  174.35  20567800 2018-01-08 16:00:00
1  174.33  21584000 2018-01-09 16:00:00
2  155.15  54390500 2018-02-08 16:00:00
3  156.41  70672600 2018-02-09 16:00:00
4  176.94  23774100 2018-03-08 16:00:00
5  179.98  32185200 2018-03-09 16:00:00
使用 pandas 分析警方執法活動

存取 datetime 屬性(1)

apple.dtypes
price                   float64
volume                    int64
date_and_time    datetime64[ns]
apple.date_and_time.dt.month
0    1
1    1
2    2
3    2
...
使用 pandas 分析警方執法活動

存取 datetime 屬性(2)

apple.set_index('date_and_time', inplace=True)

apple.index
DatetimeIndex(['2018-01-08 16:00:00', '2018-01-09 16:00:00',
               '2018-02-08 16:00:00', '2018-02-09 16:00:00',
               '2018-03-08 16:00:00', '2018-03-09 16:00:00'],
              dtype='datetime64[ns]', name='date_and_time', freq=None)
apple.index.month
Int64Index([1, 1, 2, 2, 3, 3], dtype='int64', name='date_and_time')
  • 對 DatetimeIndex 不需使用 dt 存取器
使用 pandas 分析警方執法活動

計算每月平均價格

apple.price.mean()
169.52666666666667
apple.groupby(apple.index.month).price.mean()
date_and_time
1    174.34
2    155.78
3    178.46
Name: price, dtype: float64
monthly_price = apple.groupby(apple.index.month).price.mean()
使用 pandas 分析警方執法活動

繪製每月平均價格

import matplotlib.pyplot as plt
monthly_price.plot()
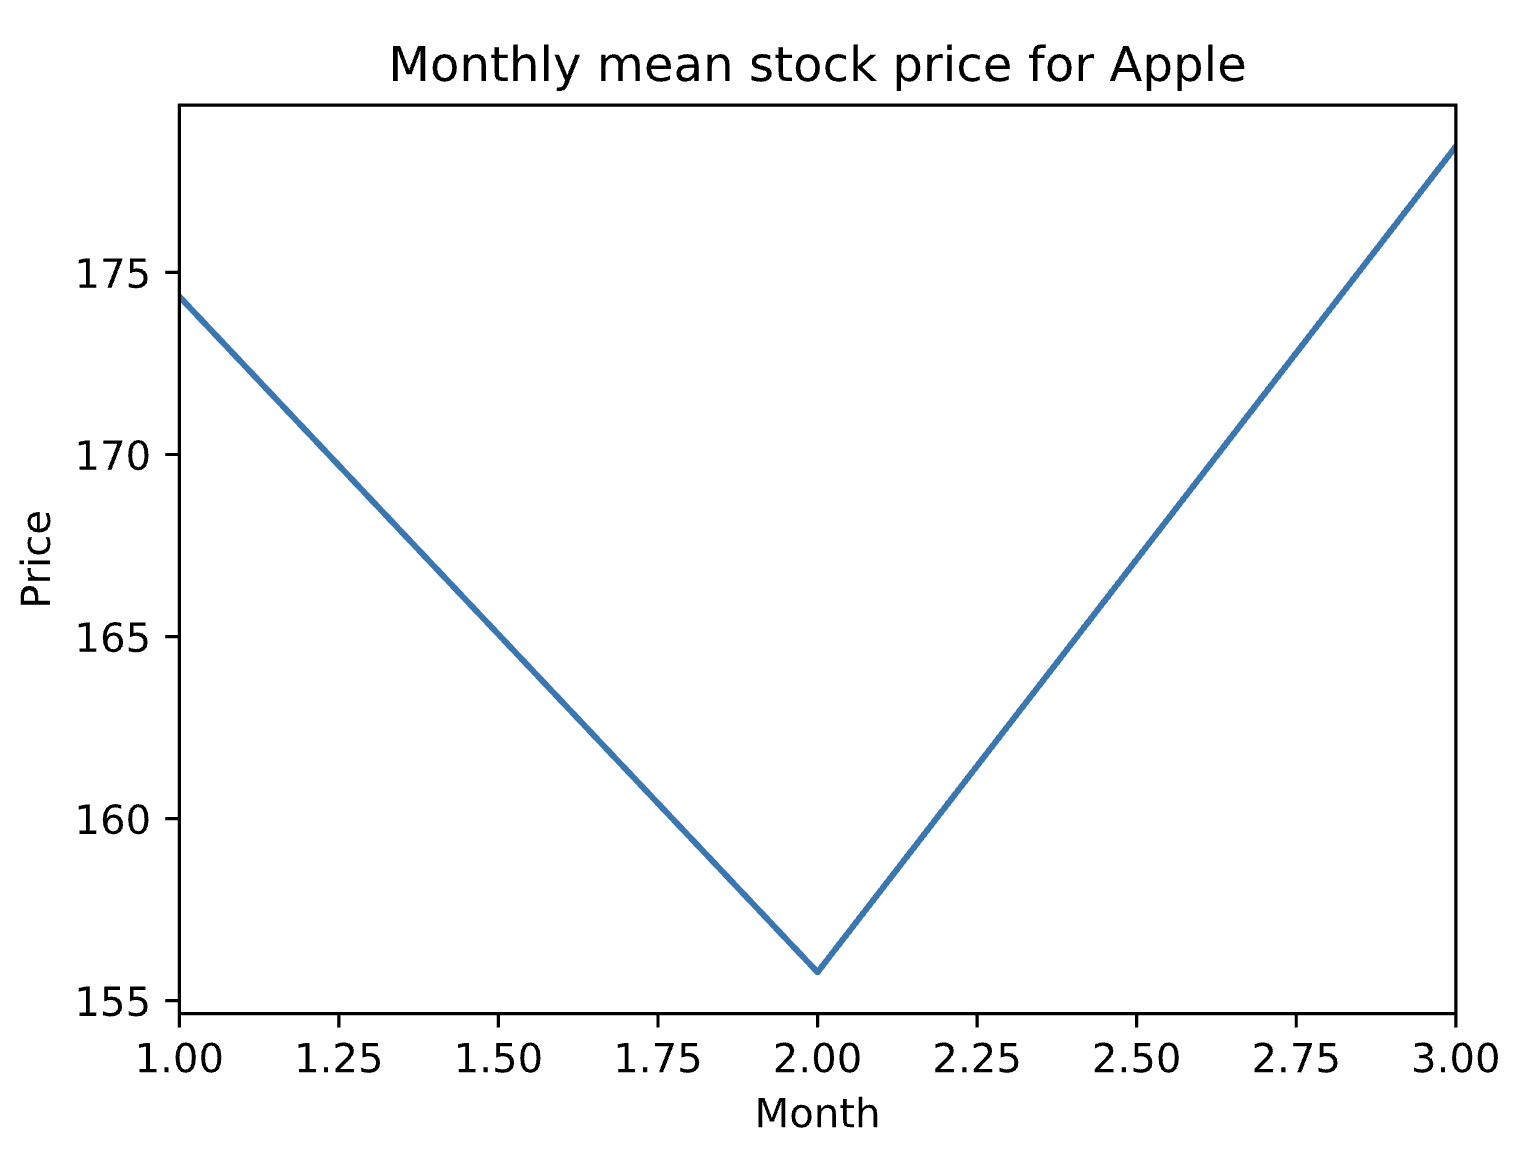
  • 折線圖:Series 索引在 x 軸,值在 y 軸
plt.xlabel('Month')
plt.ylabel('Price')
plt.title('Monthly mean stock price for Apple')
plt.show()
使用 pandas 分析警方執法活動

Apple 每月平均股價的折線圖

使用 pandas 分析警方執法活動

一起來練習吧!

使用 pandas 分析警方執法活動

Preparing Video For Download...