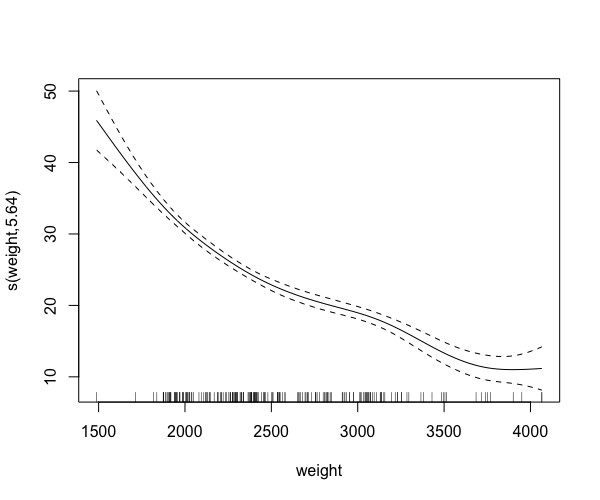
plot 指令
R 中的廣義加法模型(GAM)之非線性建模

Noam Ross
Senior Research Scientist, EcoHealth Alliance
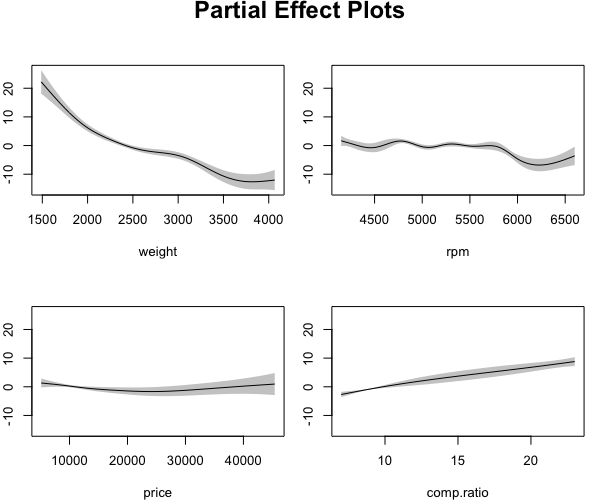
選取偏效應
plot(gam_model, select = c(2, 3))
plot(gam_model, pages = 1)
plot(gam_model, pages = 1, all.terms = TRUE)
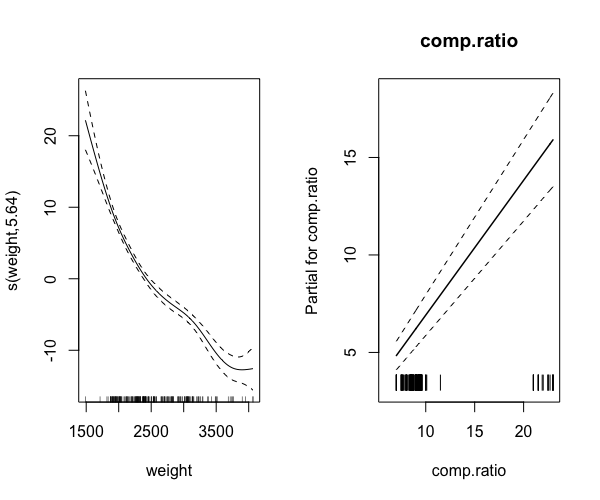
在圖上顯示資料
plot(gam_model, rug = TRUE)
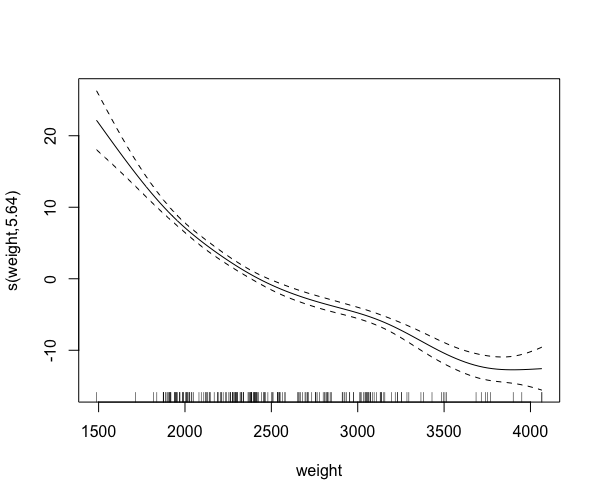
在圖上顯示資料(2)
plot(gam_model, residuals = TRUE)
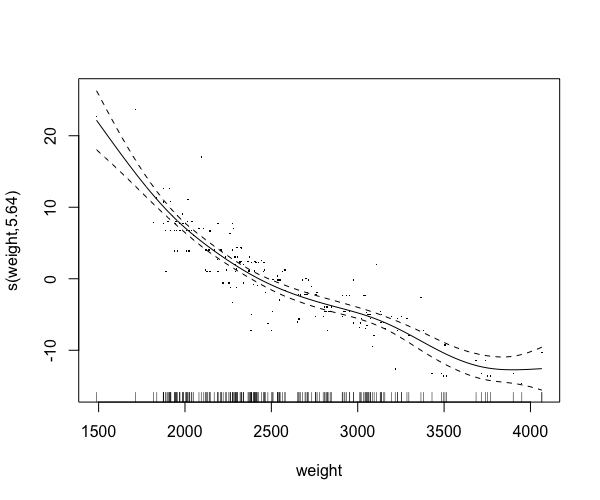
在圖上顯示資料(3)
plot(gam_model, rug = TRUE, residuals = TRUE,
     pch = 1, cex = 1)
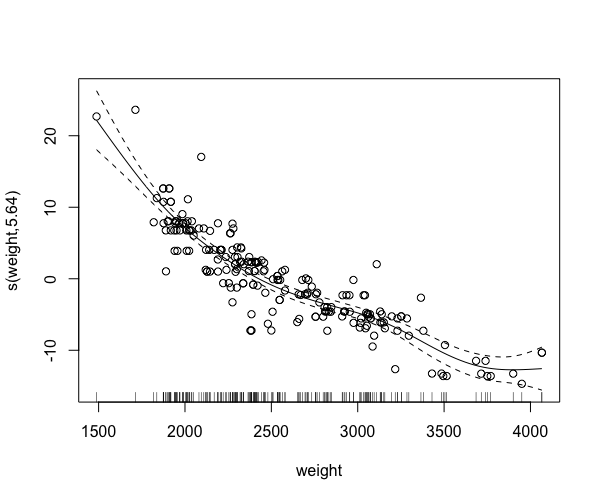
顯示標準誤
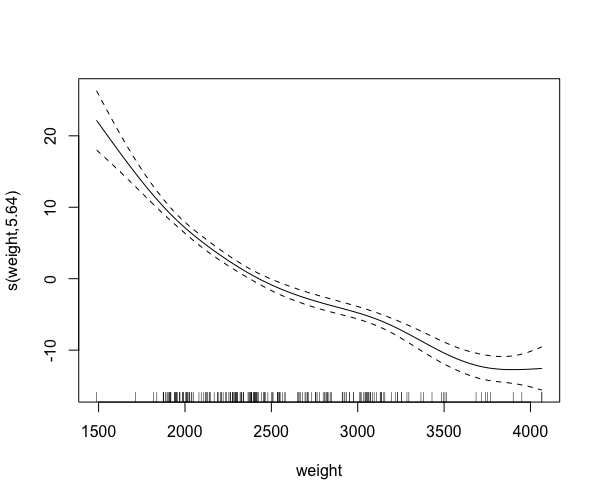
plot(gam_model, se = TRUE)
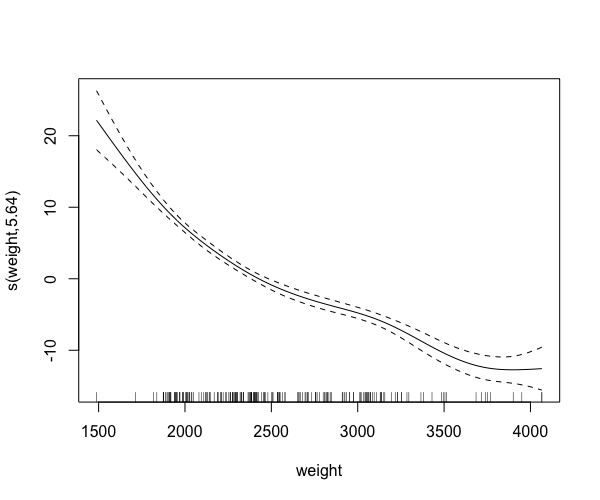
顯示標準誤(2)
plot(gam_model, shade = TRUE)
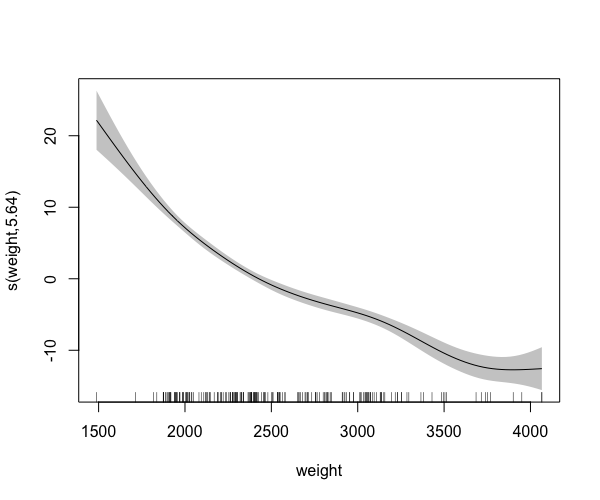
顯示標準誤
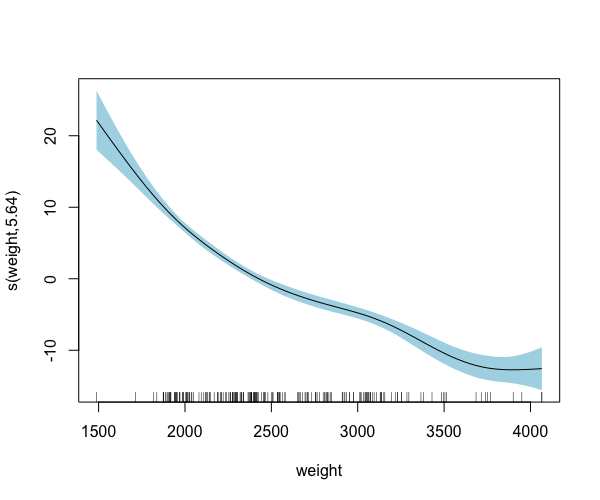
plot(gam_model, shade = TRUE, shade.col = "lightblue")
轉換標準誤
plot(gam_model, seWithMean = TRUE)
轉換標準誤(2)
plot(gam_model, seWithMean = TRUE, shift = coef(gam_model)[1])