給 SAS 使用者的 R
Melinda Higgins, PhD
Research Professor/Senior Biostatistician Emory University

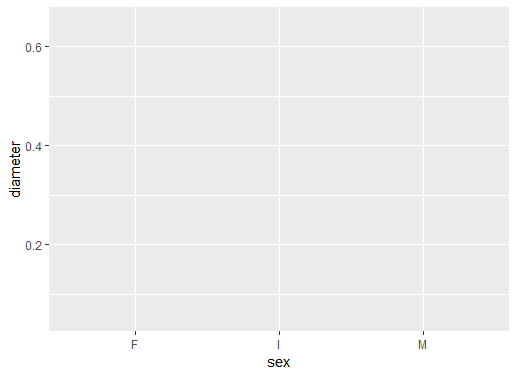
ggplot2 是 R 的強大繪圖套件ggplot 中的「GG」代表「圖形語法」ggplot2 以分層方式建構圖形# Create plot for x=sex and y=diameter
ggplot(data = abalone, aes(sex, diameter))
ggplot() 定義基底圖層data = abalone將 aes 設為 sex 與 diameter
目前尚未加入任何幾何物件
sexdiameter
# Add boxplot geometric object or geom
ggplot(data = abalone,
aes(sex, diameter)) +
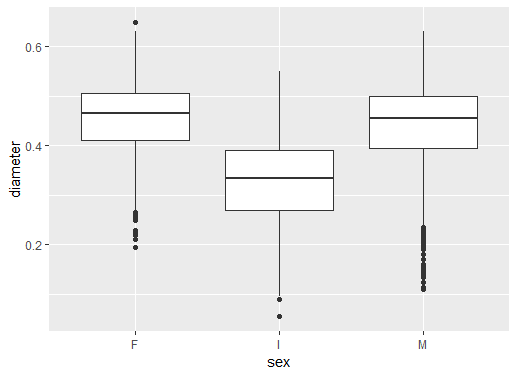
geom_boxplot()
+ 加入圖層新增盒鬚圖 geom_boxplot()
產生一系列盒鬚圖
F 雌、I 幼體、M 雄
# Add black white theme
ggplot(data = abalone,
aes(sex, diameter)) +
geom_boxplot() +
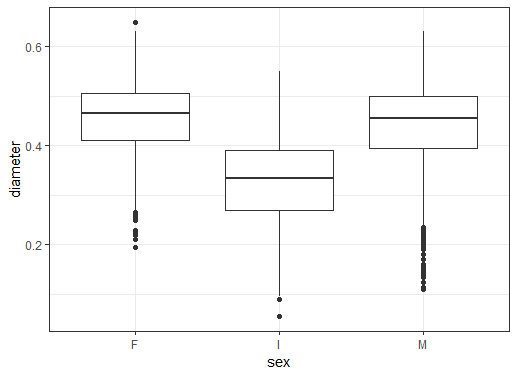
theme_bw()
theme_bw() 加入「主題」圖層
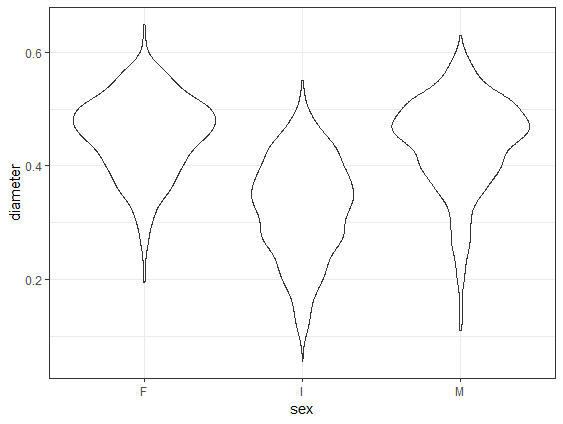
# Change to geom_violin()
ggplot(data = abalone,
aes(sex, diameter)) +
geom_violin() +
theme_bw()
geom_violin 取代 geom_boxplot
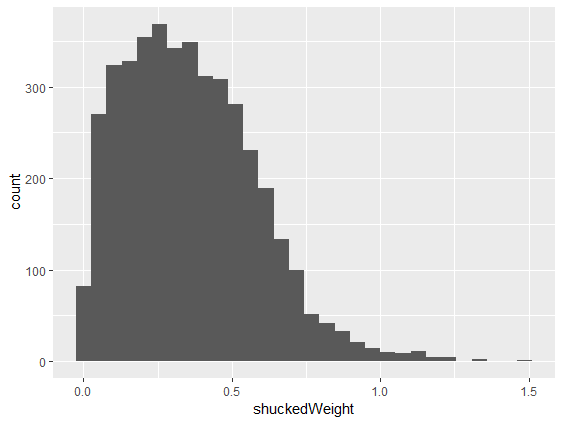
# Make histogram of shuckedWeight
ggplot(abalone, aes(shuckedWeight)) +
geom_histogram()
geom_histogram()aes() 設為 shuckedWeight
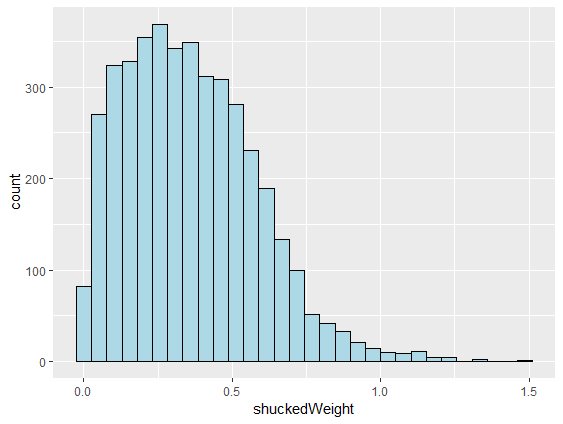
# Make lines black and fill light blue
ggplot(abalone, aes(shuckedWeight)) +
geom_histogram(color = "black",
fill = "lightblue")
colorfill 顏色() 內
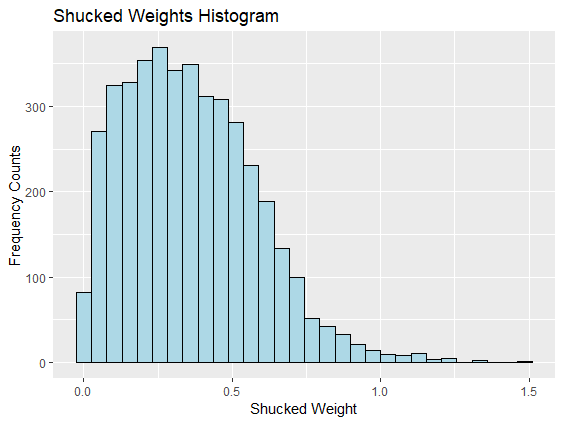
# Add x, y axis labels and title
ggplot(abalone, aes(shuckedWeight)) +
geom_histogram(color = "black",
fill = "lightblue") +
xlab("Shucked Weight") +
ylab("Frequency Counts") +
ggtitle("Shucked Weights Histogram")
xlab()、ylab() 設定軸標籤ggtitle() 設定標題
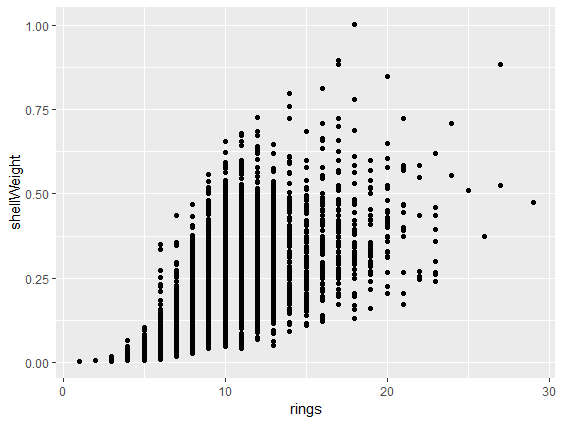
# Make scatterplot with geom_point()
ggplot(abalone,
aes(rings, shellWeight)) +
geom_point()
aes 需兩個變數geom_point() 加入點
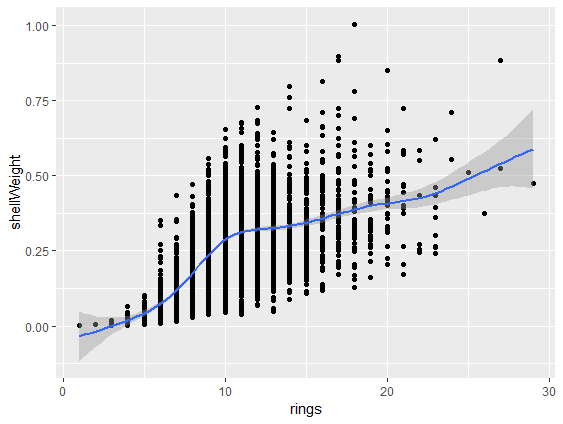
# Add smoothed fit line
ggplot(abalone,
aes(rings, shellWeight)) +
geom_point() +
geom_smooth()
geom_smooth() 平滑線
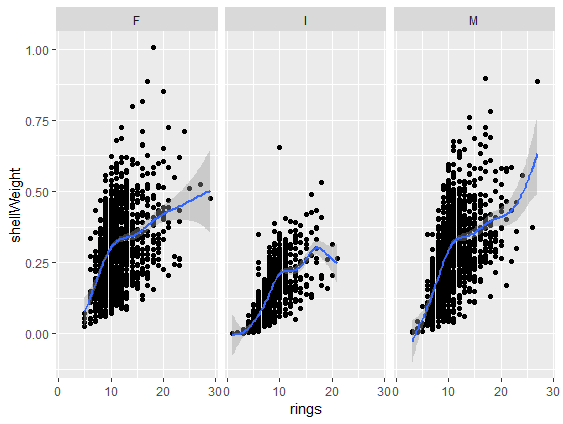
# Add panels using facet_wrap()
ggplot(abalone,
aes(rings, shellWeight)) +
geom_point() +
geom_smooth() +
facet_wrap(vars(sex))
facet_wrap() 圖層vars(sex) 指定分面變數
ggplot2 繪圖技能基礎給 SAS 使用者的 R