叢集抽樣

使用 Python 分析問卷資料

EbunOluwa Andrew

Data Scientist

什麼是叢集抽樣?

  • 將整體母體切成多個子群

    • 子群特性與母體相近
  • 母體 -> 叢集

  • 不抽個體,隨機選取「整個子群」

由人組成的圓餅圖

使用 Python 分析問卷資料

為何叢集抽樣重要

  • 不一定能從整個母體收集資料
  • 降低因母體龐大造成的誤差

人口過多

使用 Python 分析問卷資料

叢集抽樣的步驟

  • 第一步,將母體分成叢集
  • 第二步,隨機選出這些叢集

人群叢集

使用 Python 分析問卷資料

範例資料集

print(mh_survey)
| gender | sought_treatment | country_work             |
|--------|------------------|--------------------------|
| Male   |                0 | United Kingdom           |
| Male   |                1 | United States of America |
| Male   |                1 | United Kingdom           |
| Male   |                1 | United Kingdom           |
| Female |                1 | United States of America |
| Male   |                1 | United Kingdom           |
| Male   |                0 | United States of America |
...
使用 Python 分析問卷資料

範例資料與圖形

mh_survey.groupby('country_work')[
  'gender'].count()
groups = mh_survey.groupby(
  'country_work')['gender'].count(
).reset_index()
groups.columns=['country_work','count']

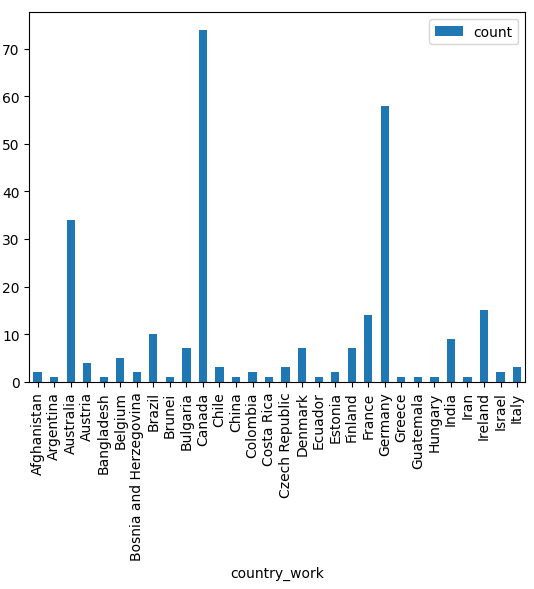
groups.plot.bar(x='country_work',
                y='count')

科技從業者居住地的長條圖

1 _部分資料因版面而僅繪製_
使用 Python 分析問卷資料

選取叢集

unique_countries = list(set(mh_survey.country_work))

random_clusters = np.random.choice(unique_countries, size = 10, replace = False)

print(random_clusters)
array(['Finland', 'Australia', 'Sweden', 'South Africa', 'Pakistan',
       'France', 'Ecuador', 'United Arab Emirates', 'United Kingdom',
       'Bangladesh'], dtype='<U24')
使用 Python 分析問卷資料

建立叢集樣本

cluster_sample = mh_survey[mh_survey.country_work.isin(random_clusters)]
print(cluster_sample.head())
| gender | sought_treatment | US_state_live        |
|--------|------------------|----------------------|
| Male   |                1 |             Pakistan |
| Male   |                1 |             Pakistan |
| Male   |                1 | United Arab Emirates |
| Male   |                1 |             Pakistan |
| Female |                0 |           Bangladesh |
使用 Python 分析問卷資料

繪製叢集樣本圖

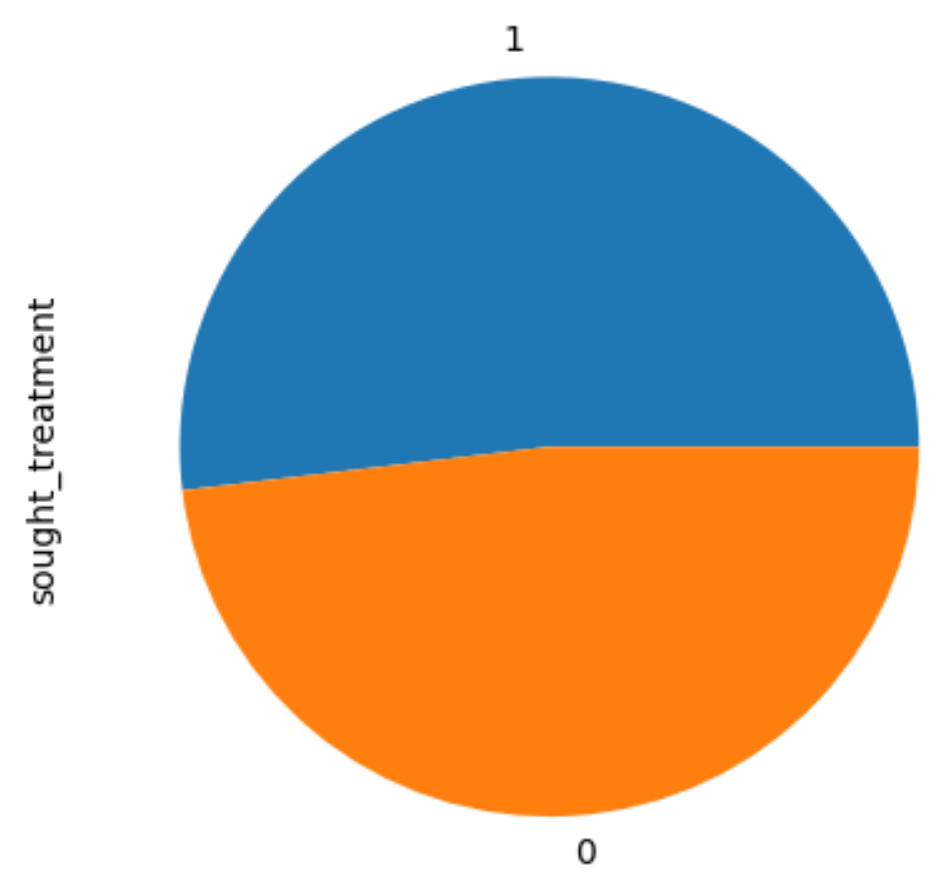
treatment_pie = cluster_sample.sought_treatment.value_counts(normalize = True)
treatment_pie.plot.pie()

sought_treatment 的圓餅圖

使用 Python 分析問卷資料

繪製叢集樣本圖

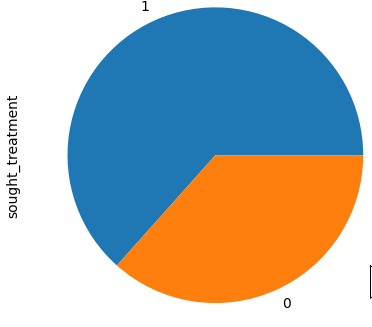
array(['Bangladesh', 'South Africa', 'Other', 'Norway', 'Poland',
       'Romania', 'New Zealand', 'France', 'United States of America',
       'Bulgaria'], dtype='<U24')

sought_treatment 的圓餅圖

使用 Python 分析問卷資料

一起來練習吧!

使用 Python 分析問卷資料

Preparing Video For Download...