迴歸分析

使用 Python 分析問卷資料

EbunOluwa Andrew

Data Scientist

迴歸分析

  • 理解變數間的關係
  • 用於預測精確結果
  • 衡量自變數對應變數的影響
  • 預測未來機會與風險
  • 將大量原始資料轉為可行資訊
  • 為決策提供事實依據

試圖阻止下跌的財務箭頭

使用 Python 分析問卷資料

使用普通最小平方法(OLS)的線性迴歸

  • 線性迴歸模型
    • 假設 x 與 y 為線性關係
    • y = m * x + b
    • 普通最小平方法(OLS)
    • 最小化 Sum((預測−觀察)^2)

https://seeing-theory.brown.edu/regression-analysis/index.html

1 https://seeing-theory.brown.edu/regression-analysis/index.html
使用 Python 分析問卷資料

載入資料

import pandas as pd

import numpy as np
import matplotlib.pyplot as plt
import statsmodels.api as sm
exercise_data = pd.read_csv('workout_survey_data.csv') print(exercise_data.head())
| workout_minutes | calories_burned |
|-----------------|-----------------|
| 77              | 79.775152       |
| 21              | 23.177279       |
| 22              | 25.609262       |
| 20              | 17.857388       |
使用 Python 分析問卷資料

定義變數

x = 自變數 y = 應變數

x = exercise_data.minutes.tolist()
y = exercise_data.calories.tolist() 
print(x,'\n',y)
| [77, 21, 22, 20, 36...           |
|----------------------------------|
| [79.7, 23.1, 25.6, 17.8, 41.8... |

調查資料

workout_minutes calories_burned
77 79.775152
21 23.177279
22 25.609262
20 17.857388
36 41.849864
使用 Python 分析問卷資料

加入常數項

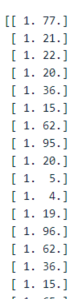
x = sm.add_constant(x)
print (x)
  • 告訴模型要擬合 b 常數項

使用 Python 分析問卷資料

執行迴歸並擬合

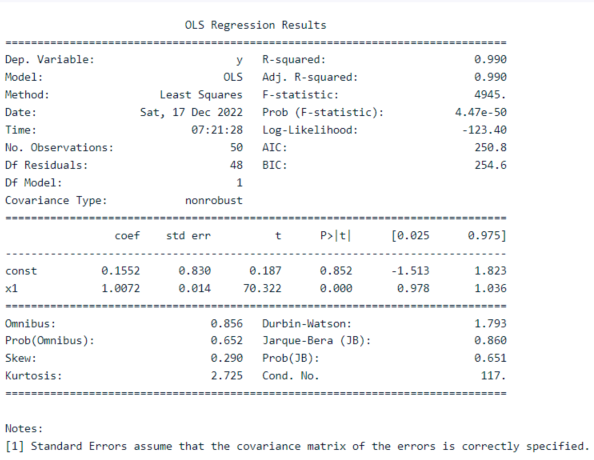
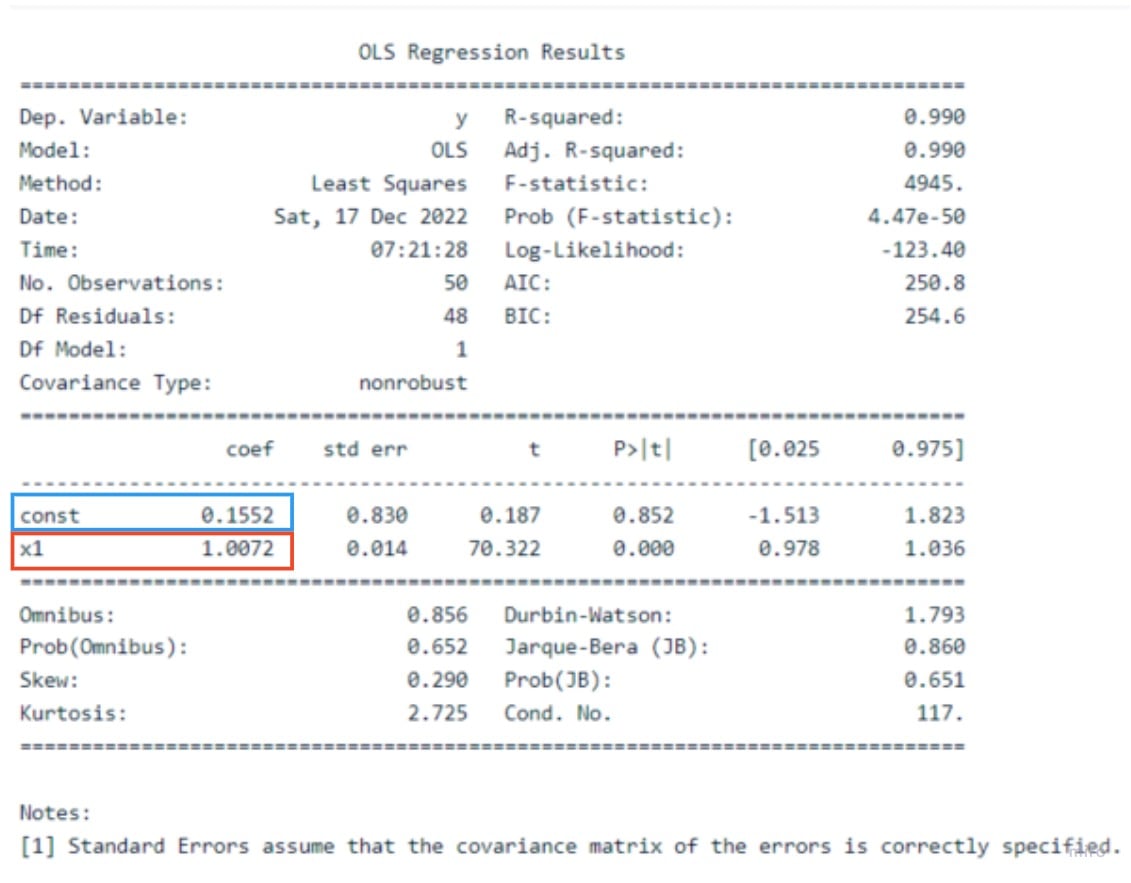
result = sm.OLS(y,x).fit()
print(result.summary())

使用 Python 分析問卷資料

取得 m 與 b

使用 Python 分析問卷資料

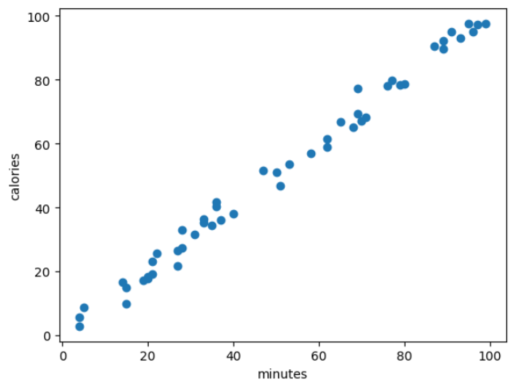
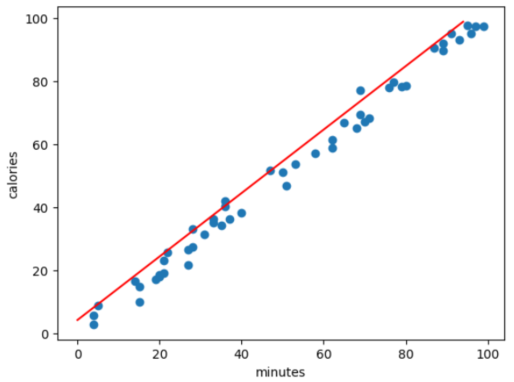
繪製原始數值

x = exercise_data.minutes.tolist()
y = exercise_data.calories.tolist()
plt.scatter(x,y)
plt.xlabel('minutes')
plt.ylabel('calories')
plt.show()

使用 Python 分析問卷資料

繪製迴歸線

max_x = exercise_data.minutes.max()
min_x = exercise_data.minutes.min()
x = np.arange(min_x, max_x, 1)

y = 1.0072*x + 0.1552
plt.plot(y, 'r') plt.show()

使用 Python 分析問卷資料

預測應變數

y = 1.0072 * 30 + 0.1552
print(y)
30.3712
使用 Python 分析問卷資料

線性迴歸的優缺點

  • 優點
    • 當資料近似線性可分時表現良好
  • 缺點
    • 對非線性情況仍假設線性關係

使用 Python 分析問卷資料

一起來練習吧!

使用 Python 分析問卷資料

Preparing Video For Download...