統計建模技術

使用 Python 分析問卷資料

EbunOluwa Andrew

Data Scientist

為何在問卷分析中使用統計建模?

  • 由變數關係做預測
  • 啟用視覺化工具
    • 洞見更易記住

Chris Liverani 攝於 Unsplash-男子手持黑色智慧型手機,前方為黑色螢幕

1 Photo by Chris Liverani on Unsplash
使用 Python 分析問卷資料

何時使用統計建模技術

  • 困難資料
  • 變數間影響
  • 預測結果

Tyler Easton 攝於 Unsplash-牆上印有各式數字

1 Photo by Tyler Easton on Unsplash
使用 Python 分析問卷資料

統計建模技術範例

  • 線性迴歸
  • 兩樣本 t 檢定
  • 卡方檢定

Алекс Арцибашев 攝於 Unsplash-遞增的長條積木

使用 Python 分析問卷資料

線性迴歸模型

  • 線性迴歸模型
    • 假設 x 與 y 之間為線性關係
    • y = m*x + b
    • y = 應變數
    • x = 自變數
    • m = 斜率
    • b = y 軸截距

Seeing Theory-Brown.edu 圖片-散點中的最佳擬合線

1 Photo from Seeing Theory-Brown.edu
使用 Python 分析問卷資料

問卷分析中的線性迴歸

employee gender company_type wfh_available mental_fatigue_score burn_rate
fff200 Male Service No 3 0.24
fff500 Female Service Yes 5.7 0.45
fff700 Female Service Yes 5.8 0.49
fff300 Female Service Yes 6.7 0.63
fff100 Female Product Yes 4.7 0.38
fff400 Male Service Yes 3.4 0.28
fff600 Female Product Yes 5.4 0.5
fffe3400 Female Product No 6.7 0.58
fffe200 Male Service Yes 6.3 0.48
fffe3000 Male Service Yes 5.4 0.41
使用 Python 分析問卷資料

問卷分析中的線性迴歸

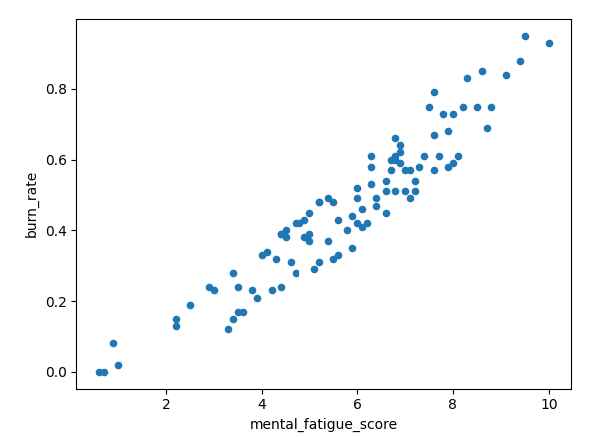
data.plot.scatter(
x='mental_fatigue_score',
y='burn_rate')
plt.show()

burn_rate 對 mental_fatigue_score

使用 Python 分析問卷資料

兩樣本 t 檢定

  • 檢定兩個母體平均數之差是否達統計顯著
  • 虛無假設=兩個母體平均數相等
  • 對立假設=兩個母體平均數相等

Olesia Bahrii 攝於 Unsplash-兩串葡萄

1 Photo by Olesia Bahrii on Unsplash
使用 Python 分析問卷資料

問卷分析中的兩樣本 t 檢定

employee gender company_type wfh_available mental_fatigue_score burn_rate
fff100 Female Product Yes 4.7 0.38
fff400 Male Service Yes 3.4 0.28
fff600 Female Product Yes 5.4 0.5
company_type burn_rate
Service 0.57
Service 0.75
Service 0.51
Service 0.57
company_type burn_rate
Product 0.51
Product 0.79
Product 0.66
Product 0.39
使用 Python 分析問卷資料

卡方檢定

  • 檢定兩個類別變數之間是否達統計顯著
  • 虛無假設=變數間沒有顯著關聯
  • 對立假設=變數間有顯著關聯
使用 Python 分析問卷資料

問卷分析中的卡方檢定

  • 變數 #1

    • company_type
    • Product 或 Service
  • 變數 #2

    • wfh_available
    • Yes 或 No
company_type wfh_available
Product Yes
Product Yes
Product No
Service Yes
Service Yes
Product Yes
Service No
Service No
Product Yes
Service Yes
使用 Python 分析問卷資料

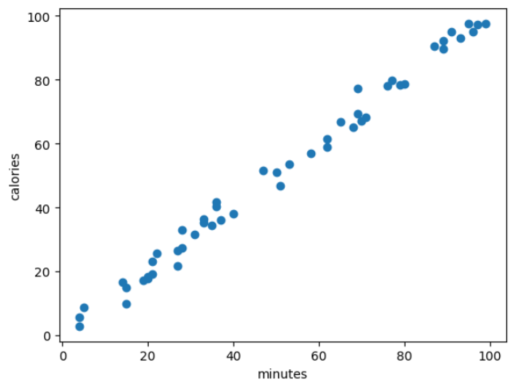
用哪種技術?-線性迴歸

兩個變數=數值型

卡路里對分鐘數的散點圖

使用 Python 分析問卷資料

用哪種技術?-兩樣本 t 檢定

  • 兩樣本 t 檢定
    • 一個變數=類別型
    • 一個變數=數值型

Diana Polekhina 攝於 Unsplash-黃底上的黑白量尺

1 Photo by Diana Polekhina on Unsplash
使用 Python 分析問卷資料

用哪種技術?-卡方檢定

  • 卡方檢定
    • 兩個變數=類別型

Element5 Digital 攝於 Unsplash-投票剪影

1 Photo by Element5 Digital on Unsplash
使用 Python 分析問卷資料

一起來練習吧!

使用 Python 分析問卷資料

Preparing Video For Download...