加權抽樣

使用 Python 分析問卷資料

EbunOluwa Andrew

Data Scientist

什麼是加權抽樣?

  • 機率不相等
  • 讓研究者在蒐集過程中修正問題

天平、秤重、平衡

使用 Python 分析問卷資料

加權抽樣常見變數

  • 人口特徵如性別、年齡、地區、教育程度
  • 考量是否參與研究的差異

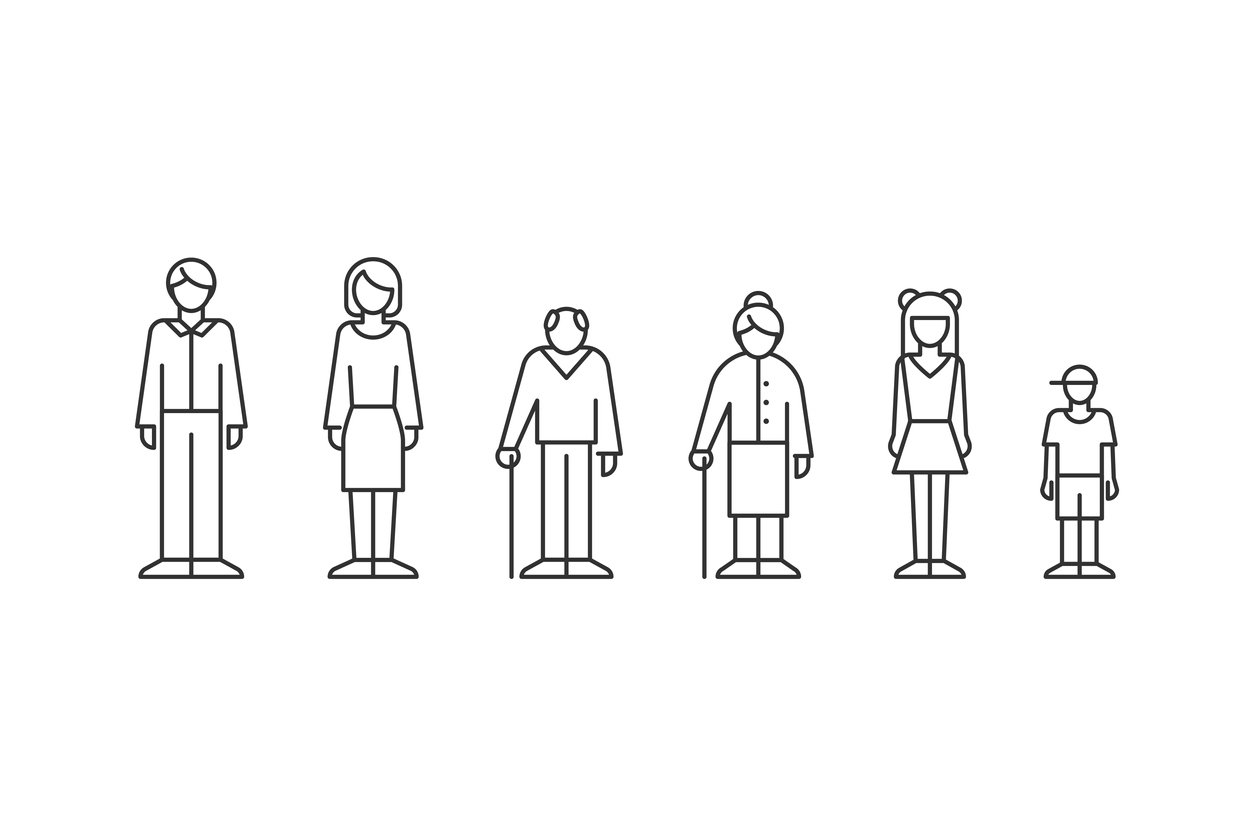
家庭,不同年齡層剪影風格

使用 Python 分析問卷資料

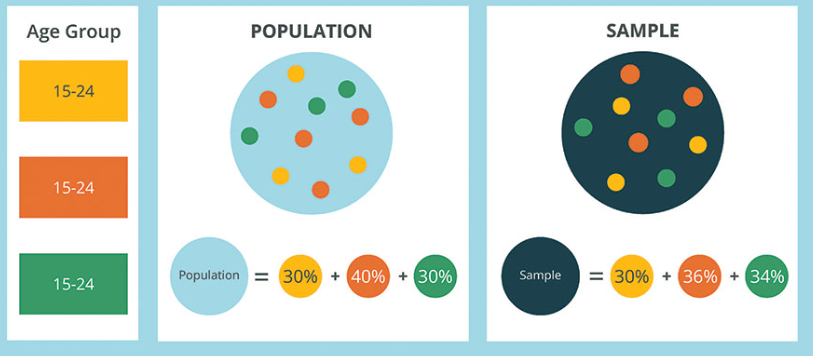
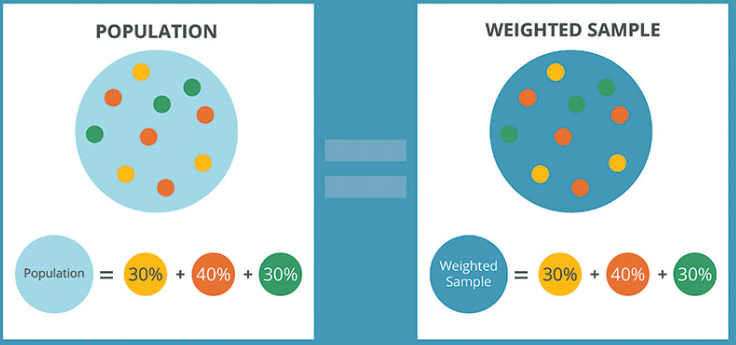
分格加權(cell-based)

1 https://www.geopoll.com/blog/weighting-survey-data-raking-cell-weighting/
使用 Python 分析問卷資料

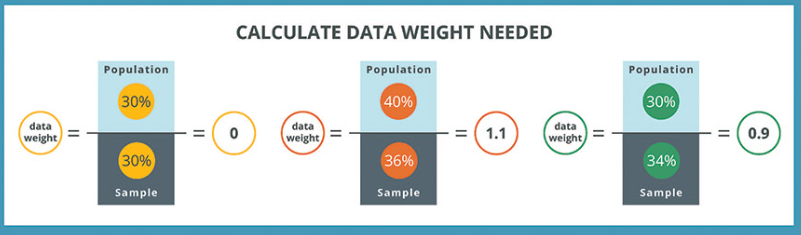
分格加權(cell based)

1 https://www.geopoll.com/blog/weighting-survey-data-raking-cell-weighting/
使用 Python 分析問卷資料

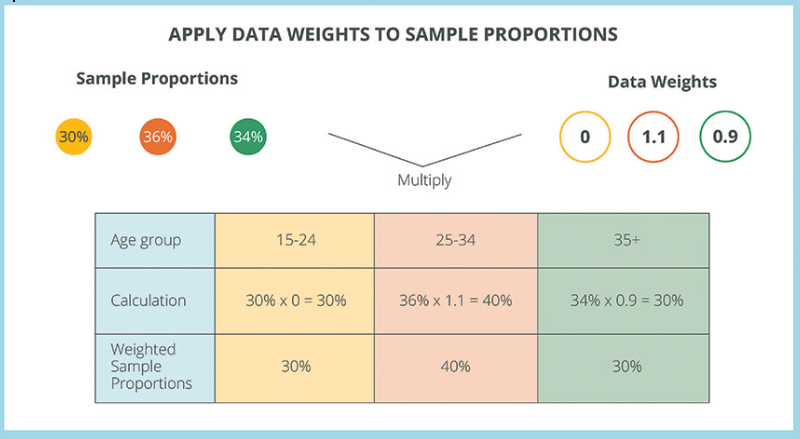
分格加權(cell based)

1 https://www.geopoll.com/blog/weighting-survey-data-raking-cell-weighting/
使用 Python 分析問卷資料

分格加權(cell based)

1 https://www.geopoll.com/blog/weighting-survey-data-raking-cell-weighting/
使用 Python 分析問卷資料

用 Python 分析年輕族群消費模式

yp_survey
| Gender | Age | Entertainment |
|--------|-----|---------------|
| female |  19 | Agree         |
| female |  20 | Agree         |
| male   |  19 | Agree         |
| female |  19 | Disagree      |
| female |  24 | Disagree      |
| male   |  18 | Agree         |
| male   |  18 | Agree         |
| male   |  20 | Disagree      |
使用 Python 分析問卷資料

用 Python 分析年輕族群消費模式

import pandas as pd
yp_crosstab = pd.crosstab(
  yp_survey['Gender'],
  yp_survey['Entertainment'])
yp_crosstab
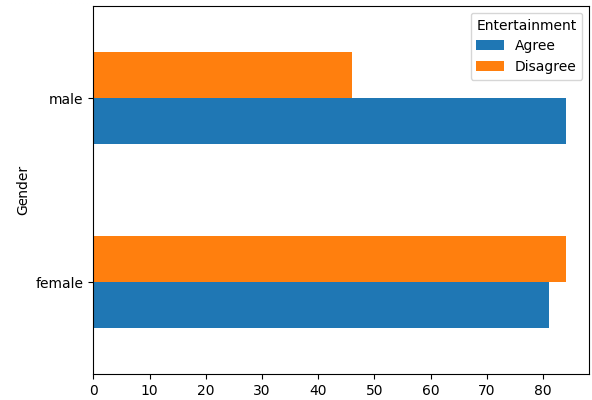
yp_crosstab.plot.barh()
|        | Agree | Disagree |
|--------|-------|----------|
| female |    81 |       84 |
| male   |    84 |       46 |

使用 Python 分析問卷資料

用 Python 分析年輕族群消費模式

survey = yp_survey.groupby(['Gender', 'Entertainment'])['Age'].count().reset_index()

survey.columns = ['Gender', 'Entertainment', 'Respondents'] survey
| Gender | Entertainment | Respondents |
|--------|---------------|-------------|
| female | Agree         |          81 |
| female | Disagree      |          84 |
| male   | Agree         |          84 |
| male   | Disagree      |          46 |
使用 Python 分析問卷資料

用 Python 分析年輕族群消費模式

survey['% total respondents'] = survey.Respondents * 100./survey.Respondents.sum()
survey['% of population'] = [35, 25, 20, 20]
survey['Weight'] = survey['% of population']/survey['% total respondents']
survey['Weighted Respondents'] = survey.Weight * survey.Respondents
使用 Python 分析問卷資料

用 Python 分析年輕族群消費模式

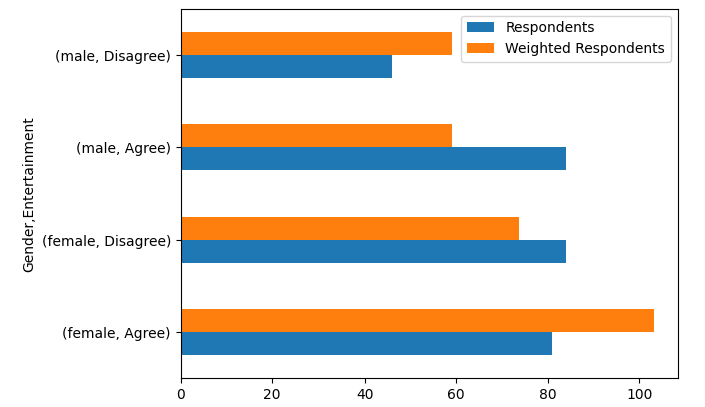
survey[['Gender','Entertainment',
        'Respondents','Weighted Respondents']].set_index(
  ['Gender','Entertainment']).plot.barh()

使用 Python 分析問卷資料

一起來練習吧!

使用 Python 分析問卷資料

Preparing Video For Download...