使用 Python 進行債券評價與分析
Joshua Mayhew
Options Trader

import numpy as np
import numpy_financial as npf
import pandas as pd
import matplotlib.pyplot as plt
bond_yields = np.arange(0, 20, 0.1)
print(bond_yields)
[0.0 0.1 0.2 0.3 0.4 0.5 0.6 0.7 0.8 0.9 1.0 1.1 1.2 1.3
...
18.5 18.6 18.7 18.8 18.9 19.0 19.1 19.2 19.3 19.4 19.5 19.6 19.7 19.8 19.9]
bond = pd.DataFrame(bond_yields, columns=['bond_yield'])
print(bond)
bond_yield
0 0.0
1 0.1
.. ...
198 19.8
199 19.9
[200 rows x 1 columns]
bond['bond_price'] = -npf.pv(rate=bond['bond_yield'] / 100, nper=10, pmt=5, fv=100)
print(bond)
bond_yield bond_price
0 0.0 150.000000
1 0.1 148.731575
.. ... ...
198 19.8 37.527719
199 19.9 37.319493
[200 rows x 2 columns]
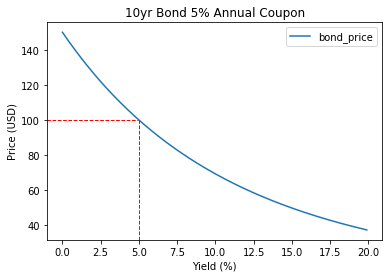
plt.plot(bond['bond_yield'], bond['bond_price'])plt.xlabel('Yield (%)')plt.ylabel('Bond Price (USD)')plt.title("10 Year Bond 5% Annual Coupon")plt.show()
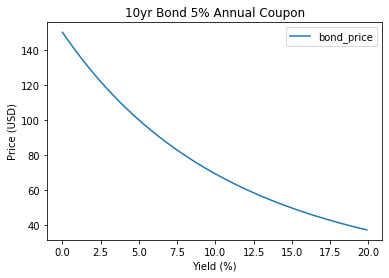
價格與殖利率反向變動
殖利率↑=折現率↑=現值降低
價格越高,報酬率(殖利率)越低

溢價債 vs. 貼現債
溢價:Price > 100,Yield < Coupon
貼現:Price < 100,Yield > Coupon
平價:Price = 100,Yield = Coupon

價格/殖利率關係為非線性
我們畫出的曲線不是直線
主因為凸性(convexity)

重點總結:

使用 Python 進行債券評價與分析