RBF 核:產生複雜資料集

R 的支援向量機

Kailash Awati

Instructor

關於 RBF 核

  • 高度彈性的核。
    • 可擬合複雜決策邊界。
  • 實務中相當常見。
R 的支援向量機

產生複雜資料集

  • 600 個點(x1、x2)
  • x1 與 x2 的分佈不同
n <- 600
set.seed(42)

df <- data.frame(x1 = rnorm(n, mean = -0.5, sd = 1),
                 x2 = runif(n, min = -1, max = 1))
R 的支援向量機

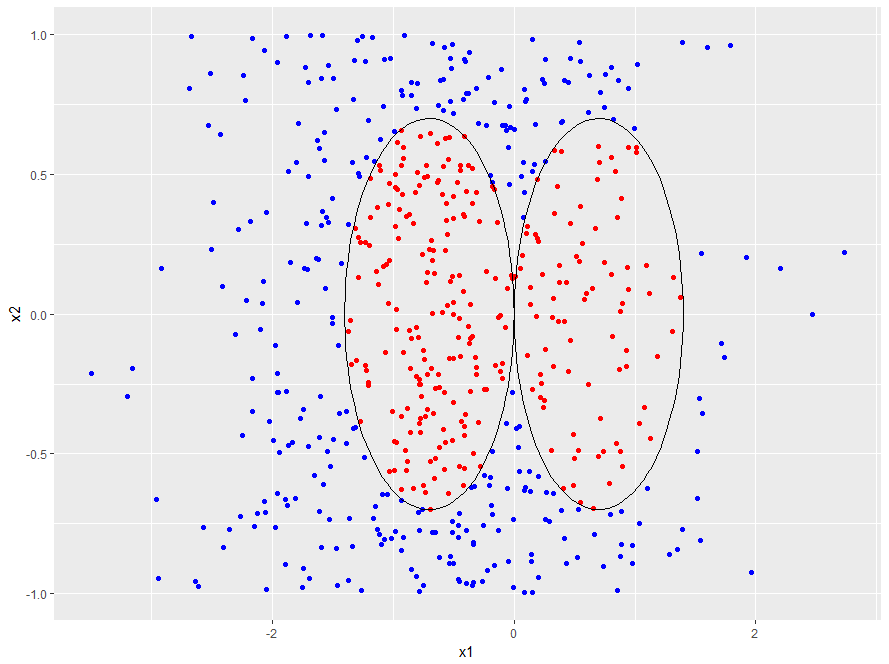
建立邊界

  • 邊界為兩個等半徑圓,且僅一點相交。
# Set radius and centers
radius <- 0.7
radius_squared <- radius ^ 2
center_1 <- c(-0.7, 0)
center_2 <- c(0.7, 0)

# Classify points df$y <- factor(ifelse( (df$x1 - center_1[1]) ^ 2 + (df$x2 - center_1[2]) ^ 2 < radius_squared | (df$x1 - center_2[1]) ^ 2 + (df$x2 - center_2[2]) ^ 2 < radius_squared, -1, 1), levels = c(-1, 1))
R 的支援向量機

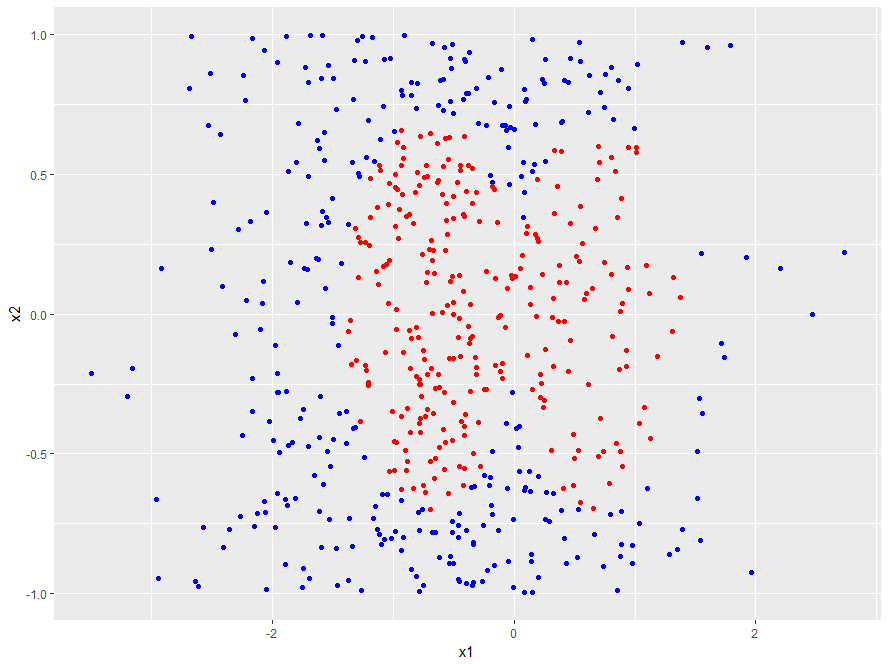
資料集視覺化

  • 使用 ggplot 視覺化資料集;以顏色區分類別
library(ggplot2)

p <- ggplot(data = df, aes(x = x1, y = x2, color = y)) + 
     geom_point() + 
     guides(color = "none") +
     scale_color_manual(values = c("red", "blue"))

p
R 的支援向量機

第 4.1 章-複雜資料集

R 的支援向量機
# Function to generate points on a circle
circle <- function(x1_center, x2_center, r, npoint = 100) {
   theta <- seq(0, 2 * pi, length.out = npoint)
   x1_circ <- x1_center + r * cos(theta)
   x2_circ <- x2_center + r * sin(theta)
   data.frame(x1c = x1_circ, x2c = x2_circ)
}

# Generate boundary and plot it boundary_1 <- circle(x1_center = center_1[1], x2_center = center_1[2], r = radius) p <- p + geom_path(data = boundary_1, aes(x = x1c, y = x2c), inherit.aes = FALSE) boundary_2 <- circle(x1_center = center_2[1], x2_center = center_2[2], r = radius) p <- p + geom_path(data = boundary_2, aes(x = x1c, y = x2c), inherit.aes = FALSE) p
R 的支援向量機

第 4.1 章-含決策邊界的複雜資料集

R 的支援向量機

一起來練習吧!

R 的支援向量機

Preparing Video For Download...