產生線性可分的資料集

R 的支援向量機

Kailash Awati

Instructor

課程概覽

  • 建立一個用來示範 SVM 關鍵概念的資料集。
  • 資料集含兩個變數與線性決策邊界。
R 的支援向量機

使用 runif() 產生二維資料集

  • 產生含 200 個點的雙變數資料集
  • 變數 x1x2 在 (0,1) 上均勻分佈。
# Preliminaries...
# Set required number of data points
n <- 200
# Set seed to ensure reproducibility
set.seed(42)

# Generate dataframe with two predictors x1 and x2 in (0,1) df <- data.frame(x1 = runif(n), x2 = runif(n))
R 的支援向量機

建立兩個類別

  • 建立兩個類別,由直線決策邊界 x1 = x2 分開
  • 此線通過 (0, 0),與水平線夾角 45 度
  • 類別變數:線下 y = -1,線上 y = 1
# Classify points as -1 or +1
df$y <- factor(ifelse(df$x1 - df$x2 > 0, -1, 1),
               levels = c(-1, 1))
R 的支援向量機

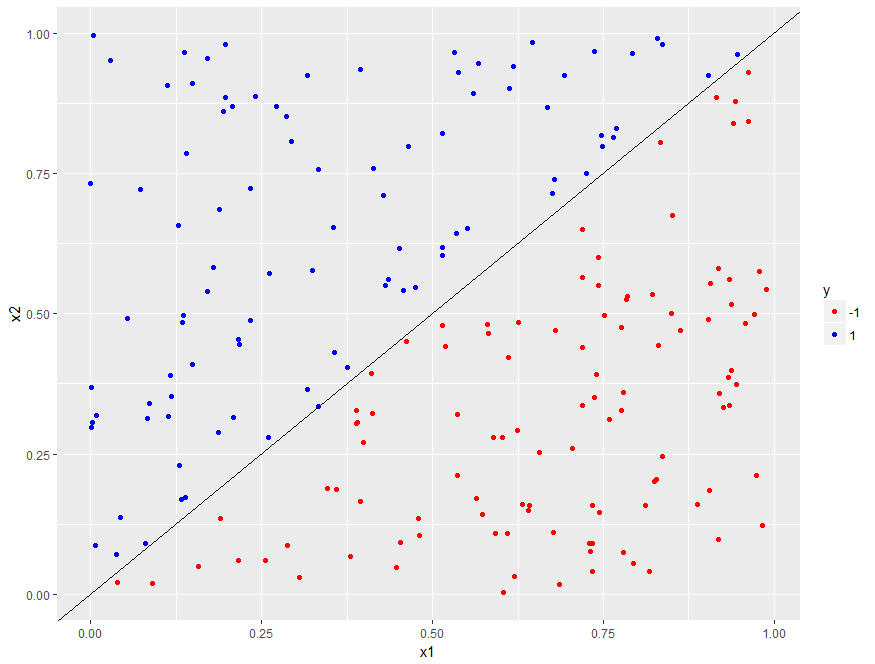
用 ggplot 視覺化資料集

  • 建立 2 維散佈圖:x 軸為 x1,y 軸為 x2
  • 以顏色區分類別(線下 = 紅色;線上 = 藍色)
  • 決策邊界為 x1 = x2:通過 (0, 0),斜率 = 1
library(ggplot2)

# Build plot
p <- ggplot(data = df, aes(x = x1, y = x2, color = y)) + 
     geom_point() +
     scale_color_manual(values = c("-1" = "red", "1" = "blue")) +
     geom_abline(slope = 1, intercept = 0)

# Display it  
p
R 的支援向量機

第 1.2 章-線性可分資料集

R 的支援向量機

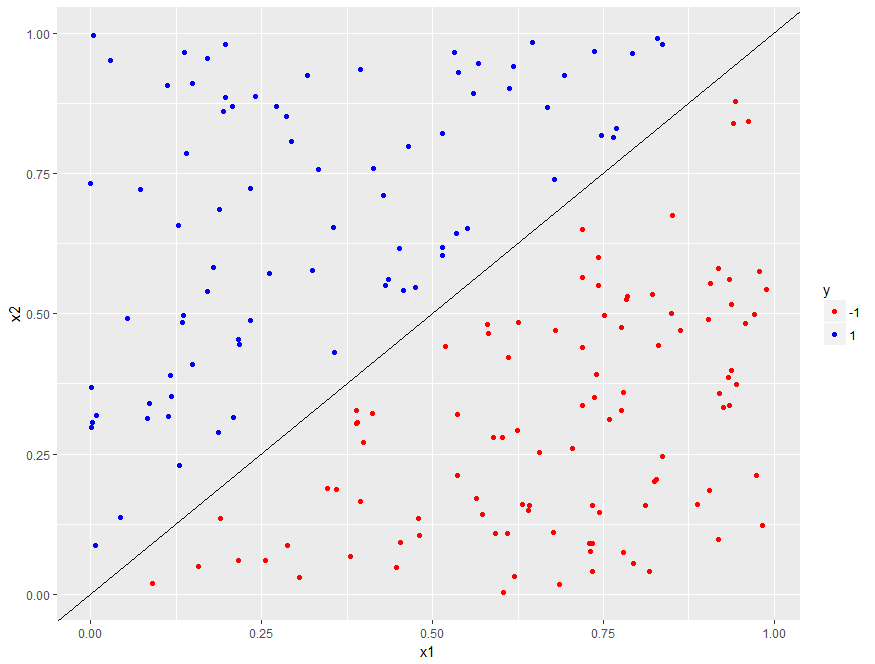
加入邊際

  • 要建立邊際,需要移除靠近邊界的點
  • 移除 x1x2 差值小於指定門檻的點
# Create a margin of 0.05 in dataset
delta <- 0.05
# Retain only those points that lie outside the margin
df1 <- df[abs(df$x1 - df$x2) > delta, ]
# Check number of data points remaining
nrow(df1)

# Replot dataset with margin (code is exactly same as before) p <- ggplot(data = df1, aes(x = x1, y = x2, color = y)) + geom_point() + scale_color_manual(values = c("red", "blue")) + geom_abline(slope = 1, intercept = 0) # Display plot p
R 的支援向量機

第 1.2 章-含邊際的線性可分資料集

R 的支援向量機

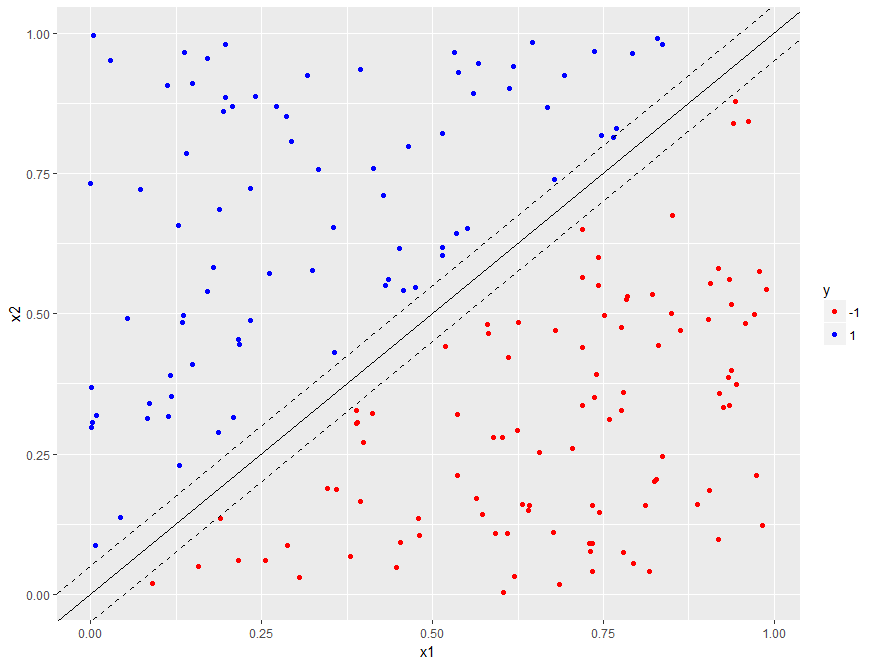
繪出邊際邊界

  • 邊際邊界為:
    • 與決策邊界平行(斜率 = 1)。
    • 位於其兩側,相距 delta 單位(delta = 0.05)。
p <- p + 
     geom_abline(slope = 1, intercept = delta, linetype = "dashed") +
     geom_abline(slope = 1, intercept = -delta, linetype = "dashed")

p
R 的支援向量機

第 1.2 章-顯示決策與邊際邊界的線性可分資料集

R 的支援向量機

一起來練習吧!

R 的支援向量機

Preparing Video For Download...