差異表現資料

使用 R 中的 limma 進行差異表達分析

John Blischak

Instructor

實驗資料

  1. 乳癌研究

    • Bioconductor 套件「breastCancerVDX」
    • 發表於 Wang et al., 2005 與 Minn et al., 2007
    • 344 位病患:209 位 ER+、135 位 ER-
  2. 慢性淋巴性白血病(CLL)研究

    • Bioconductor 套件「CLL」
    • Drs. Sabina Chiaretti 與 Jerome Ritz
    • 22 位病患:8 位穩定、14 位惡化
使用 R 中的 limma 進行差異表達分析

R 中的資料

  • 表現矩陣(x

  • 特徵資料(f)-特徵屬性

  • 表現型資料(p)-樣本屬性

使用 R 中的 limma 進行差異表達分析

表現矩陣

列=特徵,欄=樣本

class(x)
"matrix"
dim(x)
22283   344


x[1:5, 1:5]
              VDX_3     VDX_5     VDX_6
1007_s_at 11.965135 11.798593 11.777625
1053_at    7.895424  7.885696  7.949535
117_at     8.259272  7.052025  8.225930
使用 R 中的 limma 進行差異表達分析

特徵資料

列=特徵,欄=任意數量的屬性

class(f)
"data frame"
dim(f)
22283   3


f[1:3, ]
          symbol entrez   chrom
1007_s_at   DDR1    780  6p21.3
1053_at     RFC2   5982 7q11.23
117_at     HSPA6   3310    1q23
使用 R 中的 limma 進行差異表達分析

表現型資料

列=樣本,欄=任意數量的屬性

class(p)
"data frame"
dim(p)
344   3


# er = +/- for Estrogen Receptor
p[1:3, ]
      id age       er
VDX_3  3  36 negative
VDX_5  5  47 positive
VDX_6  6  44 negative
使用 R 中的 limma 進行差異表達分析

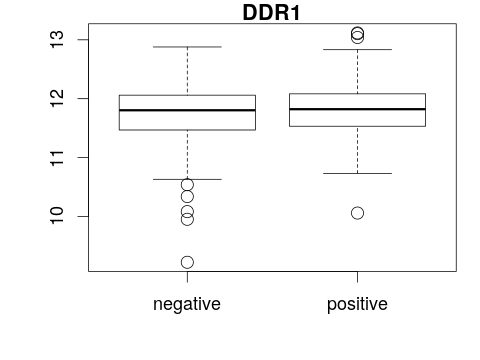
用盒鬚圖視覺化基因表現

boxplot(<y-axis> ~ <x-axis>, main = "<title>")

boxplot(<gene expression> ~ <phenotype>, main = "<feature>")
boxplot(x[1, ] ~ p[, "er"], main = f[1, "symbol"])
使用 R 中的 limma 進行差異表達分析

一起來練習吧!

使用 R 中的 limma 進行差異表達分析

Preparing Video For Download...