使用 R 中的 limma 進行差異表達分析
John Blischak
Instructor
wt
top2b
pbs
dox
dim(eset)
Features  Samples
   29532       12
table(pData(eset)[, c("genotype", "treatment")])
        treatment
genotype dox pbs
   top2b   3   3
   wt      3   3
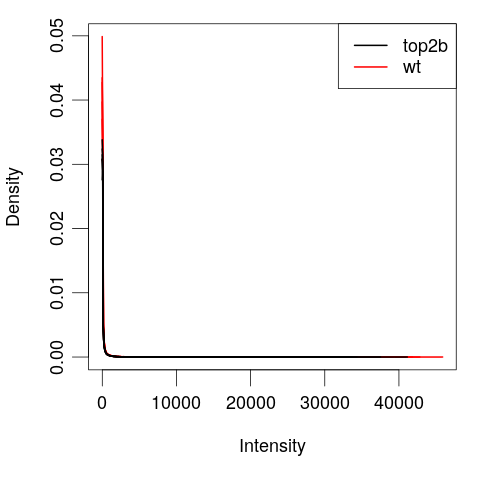
plotDensities(eset,
    group = pData(eset)[, "genotype"],
    legend = "topright")
對數轉換
分位數正規化
篩選
boxplot(<y-axis> ~ <x-axis>, main = "<title>")
boxplot(<gene expression> ~ <phenotype>, main = "<feature>")
boxplot(<Top2b expression> ~ <genotype>, main = "<Top2b info>")
主成分分析
limma 函式 plotMDS
plotMDS
你預期會有多少叢集?