使用 Python 分析美國 Census 資料
Lee Hachadoorian
Asst. Professor of Instruction, Temple University
pandas
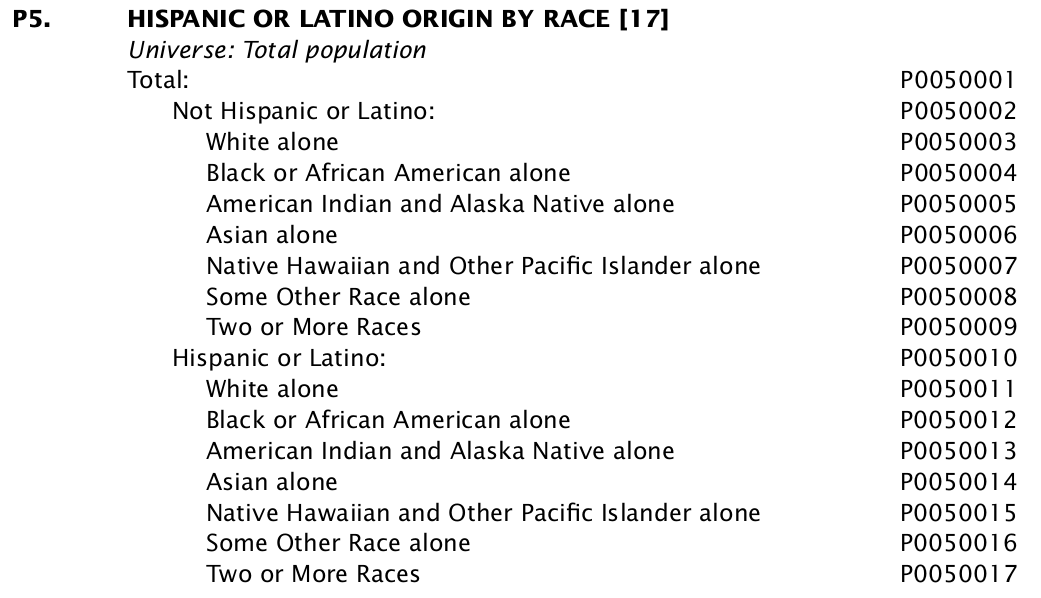
Decennial Census of Population and Housing
American Community Survey
states.head()
               total          ...           hispanic_multiracial
Alabama      4779736          ...                          10806
Alaska        710231          ...                           6507
Arizona      6392017          ...                         103669
Arkansas     2915918          ...                          11173
California  37253956          ...                         846688

[5 rows x 17 columns]
import seaborn as sns

sns.set()

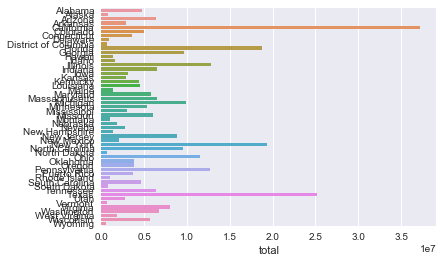
sns.barplot(
    x = "total",
    y = states.index,
    data = states
    )
import seaborn as sns
sns.set()
sns.barplot( x = "total", y = states.index, data = states )
延伸學習:Data Visualization with Seaborn