鄰里隔離的時間變化

使用 Python 分析美國 Census 資料

Lee Hachadoorian

Asst. Professor of Instruction, Temple University

直方圖

counties.head()
   totalpop state county
0     54571    01    001
1     22915    01    007
2     34215    01    017
3     25989    01    019
4     25833    01    025
sns.distplot(counties["totalpop"], 
             kde = False)
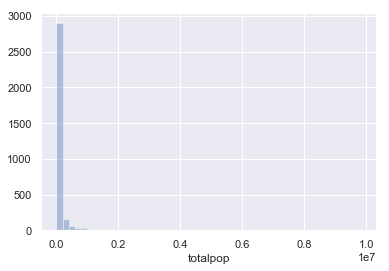
郡級人口的直方圖。

使用 Python 分析美國 Census 資料

直方圖

tracts.head()
   totalpop state county   tract
0      1912    01    001  020100
1      2170    01    001  020200
2      3373    01    001  020300
3      4386    01    001  020400
4     10766    01    001  020500
sns.distplot(tracts["totalpop"],
             kde = False)
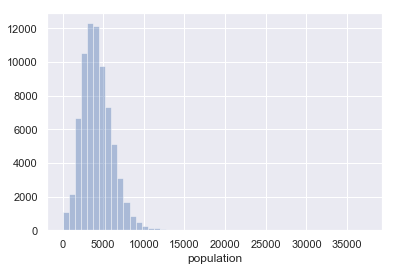
普查分區人口的直方圖。

使用 Python 分析美國 Census 資料

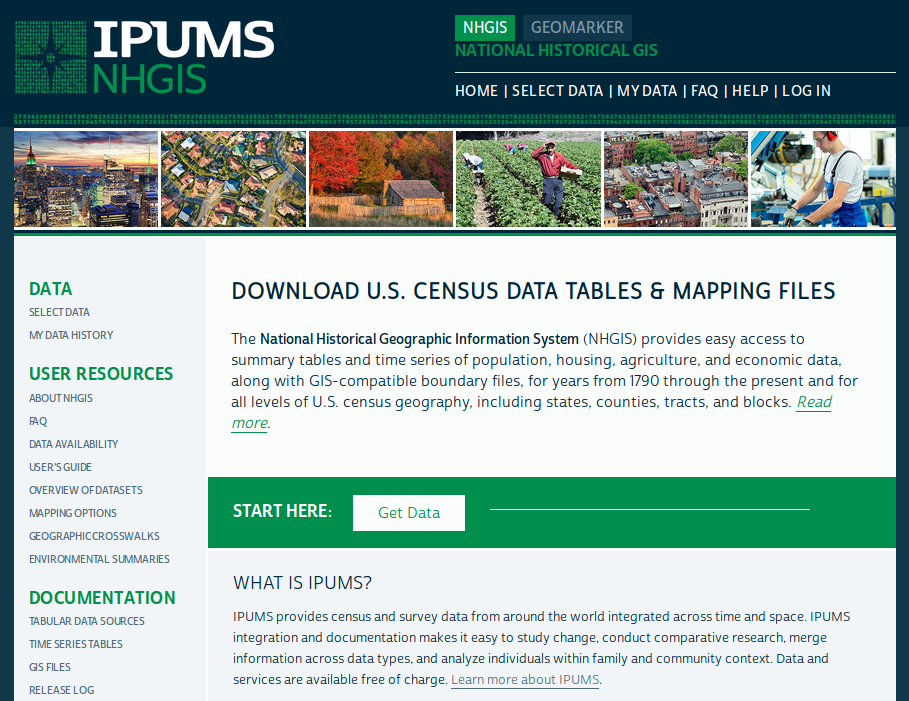
National Historical GIS 首頁的螢幕擷取畫面。

IPUMS NHGIS,University of Minnesota,www.nhgis.org

使用 Python 分析美國 Census 資料

NHGIS 與 Census Bureau FTP 比較

  1. 可回溯至 1790 年(首屆美國人口普查)的歷史資料
  2. 用於繪製普查資料的 GIS 檔案
  3. 一致地理區域的時間序列資料
使用 Python 分析美國 Census 資料

一起來練習吧!

使用 Python 分析美國 Census 資料

Preparing Video For Download...