遷移

使用 Python 分析美國 Census 資料

Lee Hachadoorian

Asst. Professor of Instruction, Temple University

ACS 流動性表格——常見欄位

表名為「B07xxx」,通常包含這些欄位:

  • 區域現住人口總數
    • 1 年前住同一房屋(未搬家)
    • 在郡內搬遷
    • 從同州不同郡搬來
    • 從其他州搬來
    • 從海外搬來
使用 Python 分析美國 Census 資料

ACS 流動性表格——其他特色

  • 流動性交叉於:
    • 年齡
    • 學歷
    • 所得
    • 公民身分
    • 等等
  • 以 1 年前居住地為基準的表格
  • 波多黎各(例如 B07001PR:波多黎各現住人口依年齡之過去一年地理流動)
使用 Python 分析美國 Census 資料

前往加州

print(to_cali_2016)
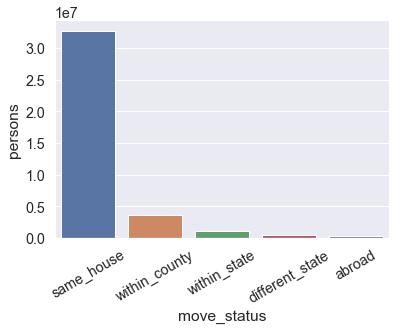
       move_status   persons
0       same_house  32740745
1    within_county   3581323
2     within_state   1062756
3  different_state    501384
4           abroad    305148
sns.barplot(x = "move_status", 
            y = "persons", 
            data = to_cali_2016)

資料來源:ACS 2016 表 B07001:United States 現住人口依年齡之過去一年地理流動。

長條圖:顯示未搬家、在郡內、州內、跨州,以及從海外搬遷的人數。

使用 Python 分析美國 Census 資料

遷移流向

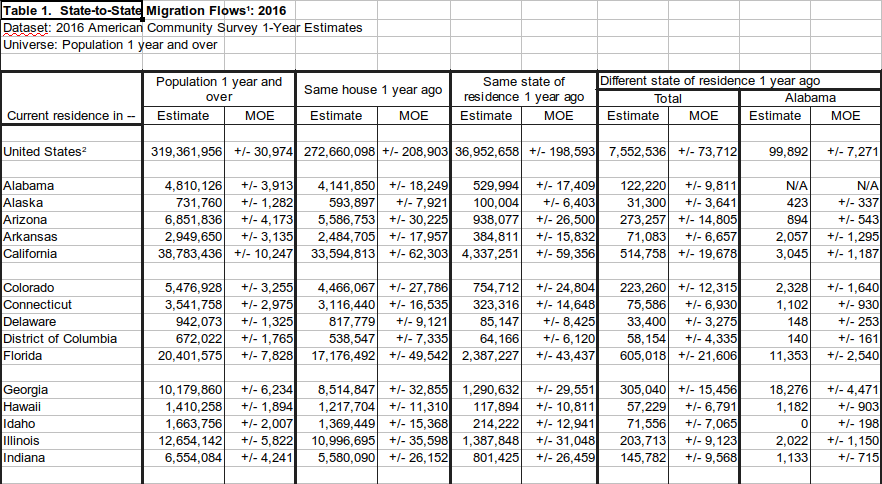
試算表:顯示美國各州內與跨州搬遷的人數估計與誤差範圍。

使用 Python 分析美國 Census 資料

州際遷移矩陣

print(state_to_state.head())
            Alabama  Alaska  Arizona  ...  Wisconsin  Wyoming  Puerto Rico
Alabama         NaN   576.0   1022.0  ...      874.0    539.0        335.0
Alaska        423.0     NaN   1176.0  ...      260.0    291.0        848.0
Arizona       894.0  1946.0      NaN  ...     6736.0    925.0       1462.0
Arkansas     2057.0   103.0    836.0  ...      539.0    178.0        857.0
California   3045.0  4206.0  33757.0  ...     7354.0   2674.0       1102.0
使用 Python 分析美國 Census 資料

州際遷移熱圖

sns.heatmap(state_to_state, cmap="YlGnBu")
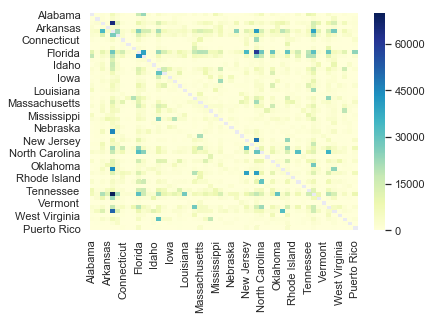
熱圖:列為起始州、欄為目的州,依各州際遷移人數著色。

使用 Python 分析美國 Census 資料

一起來練習吧!

使用 Python 分析美國 Census 資料

Preparing Video For Download...