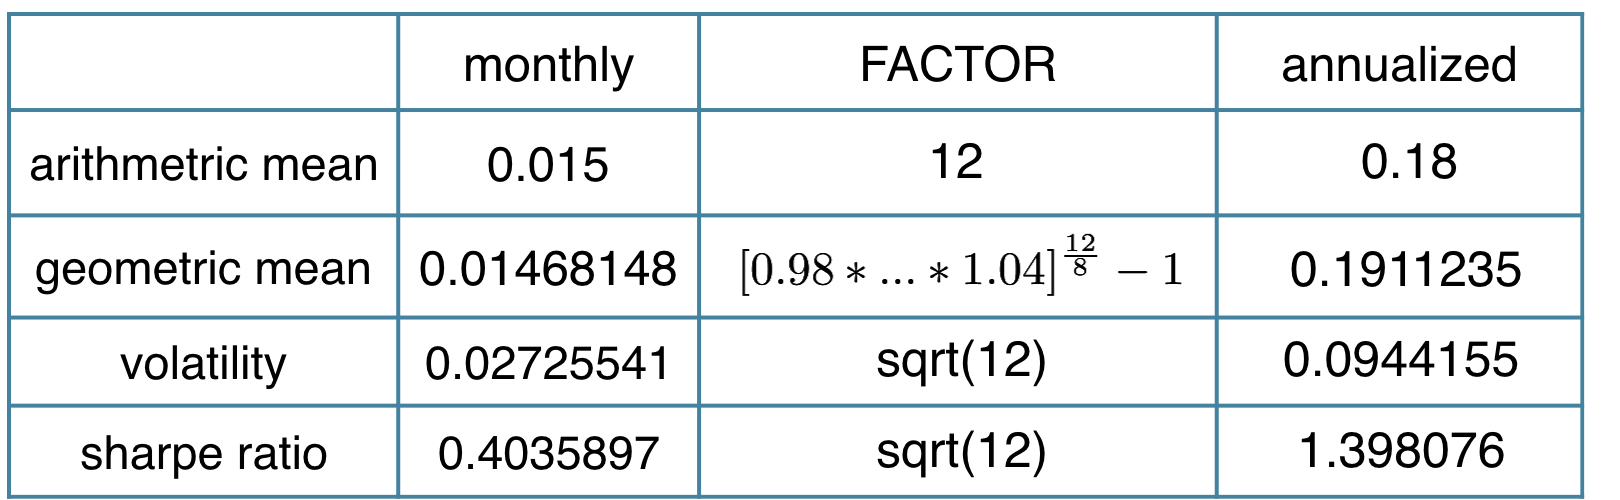
(年化)夏普比率
R 投資組合分析入門

Kris Boudt
Professor, Free University Brussels & Amsterdam
績效基準比較
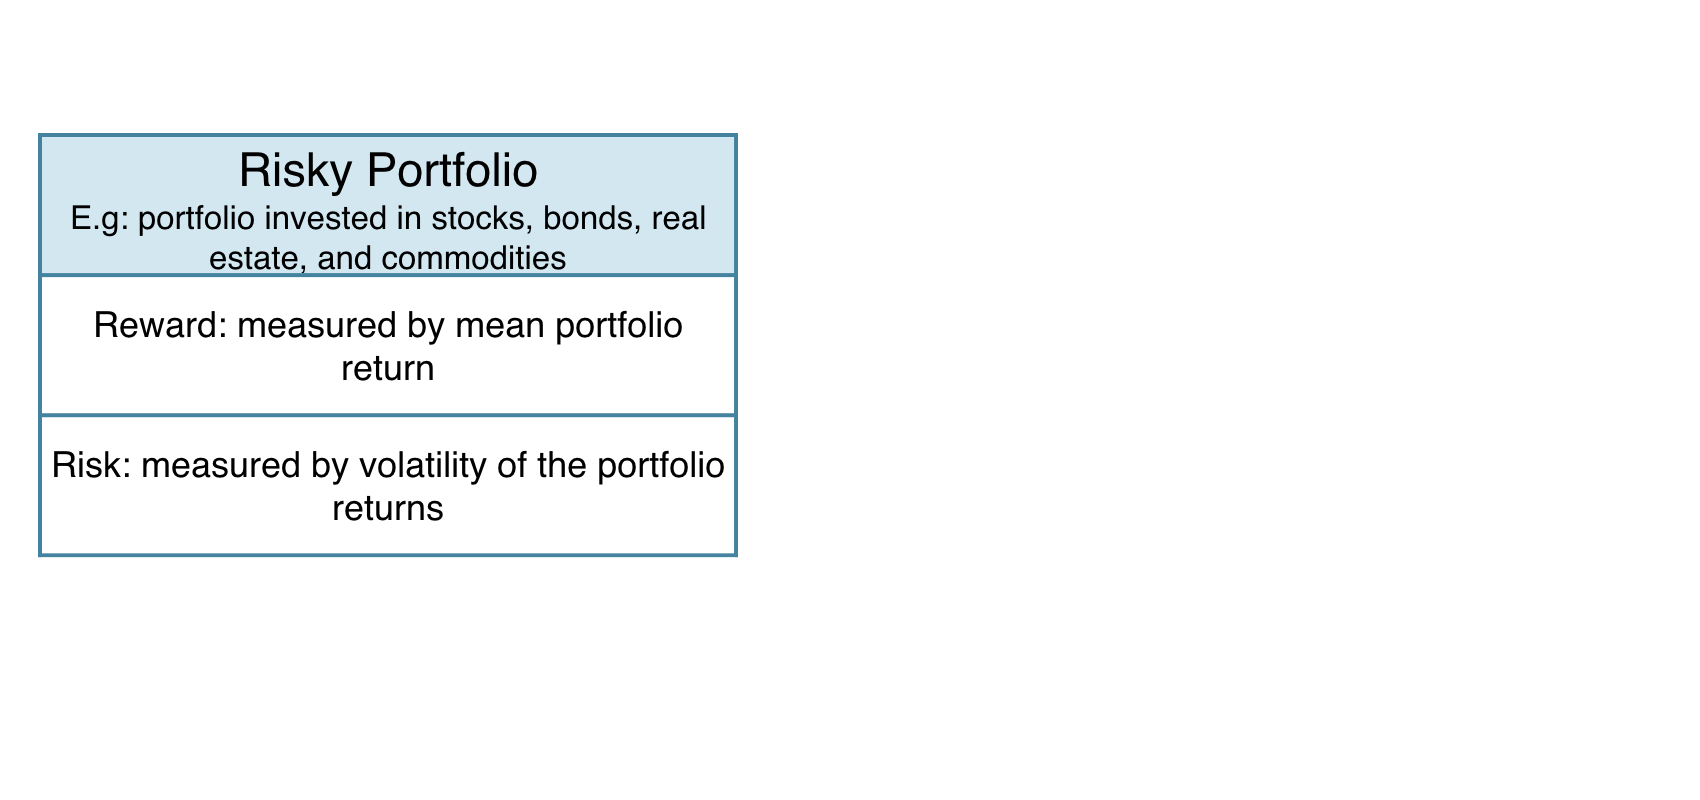
績效基準比較
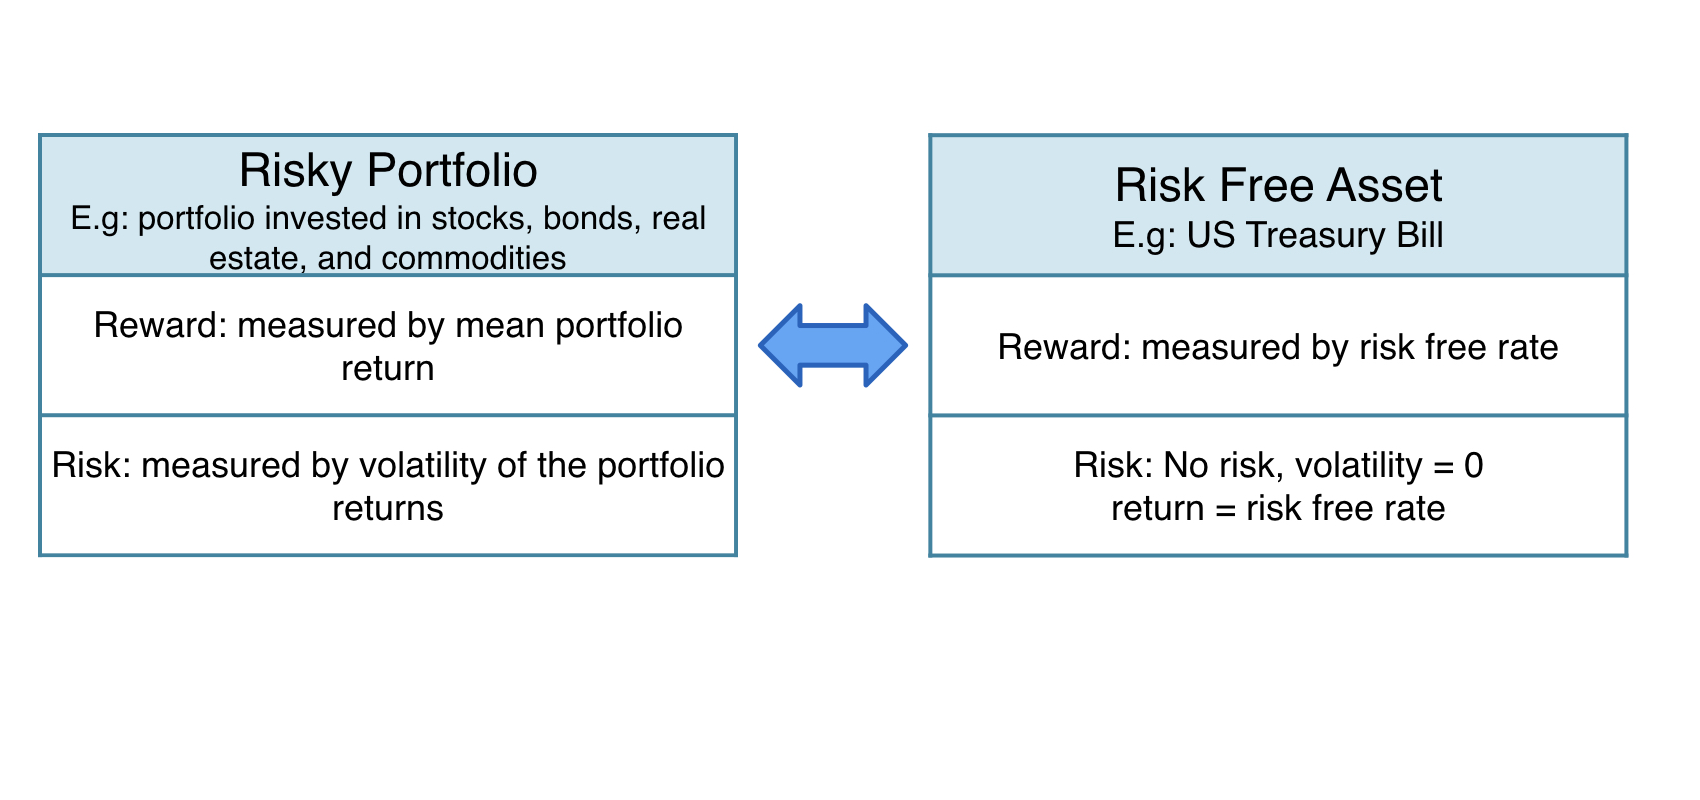
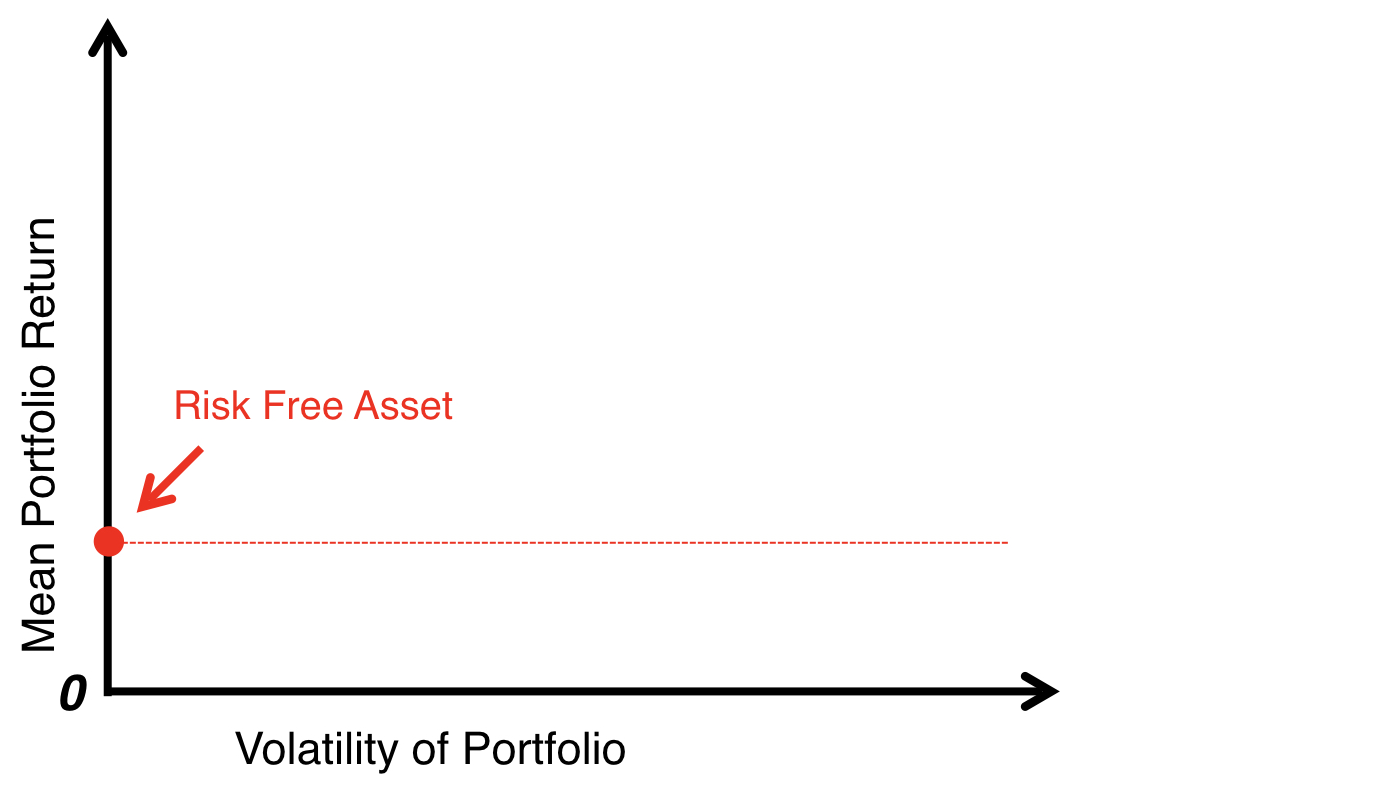
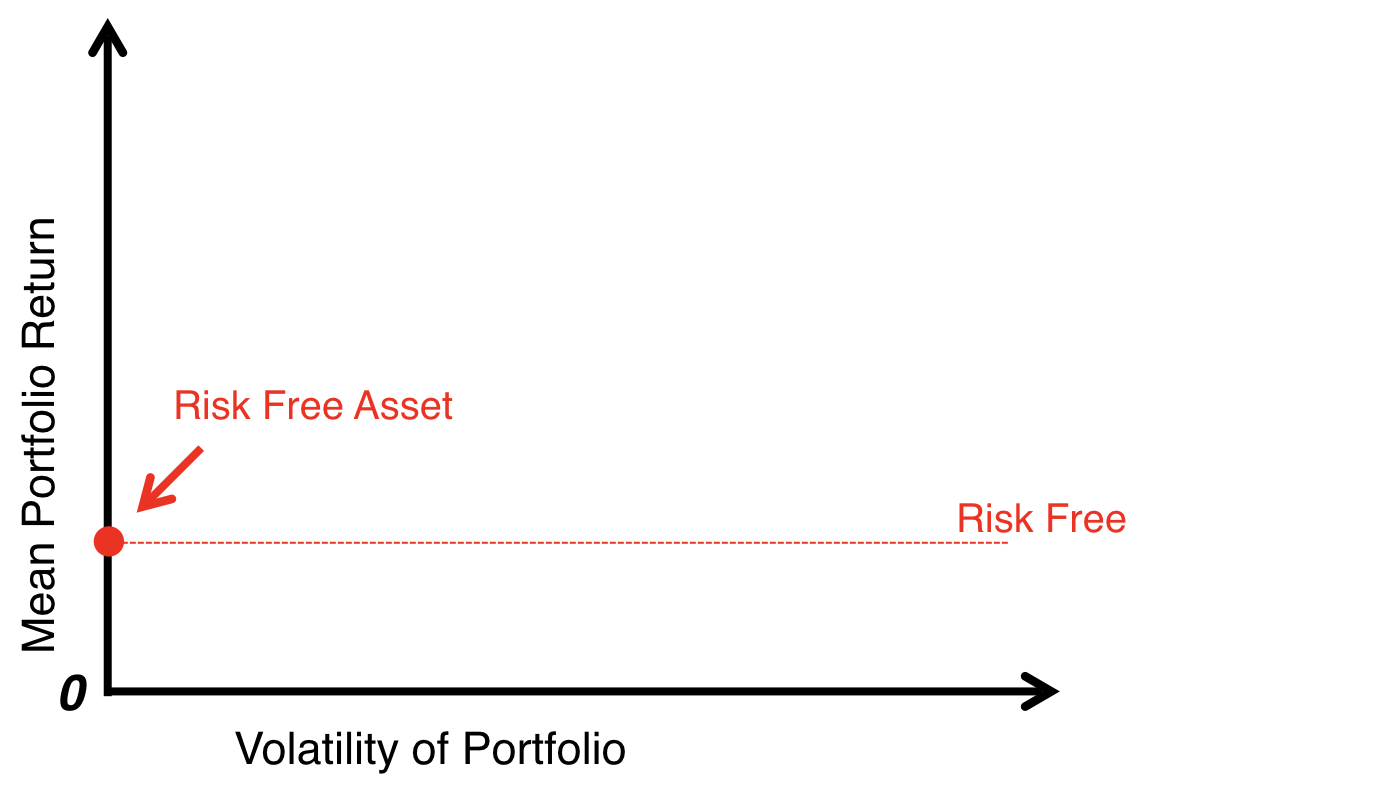
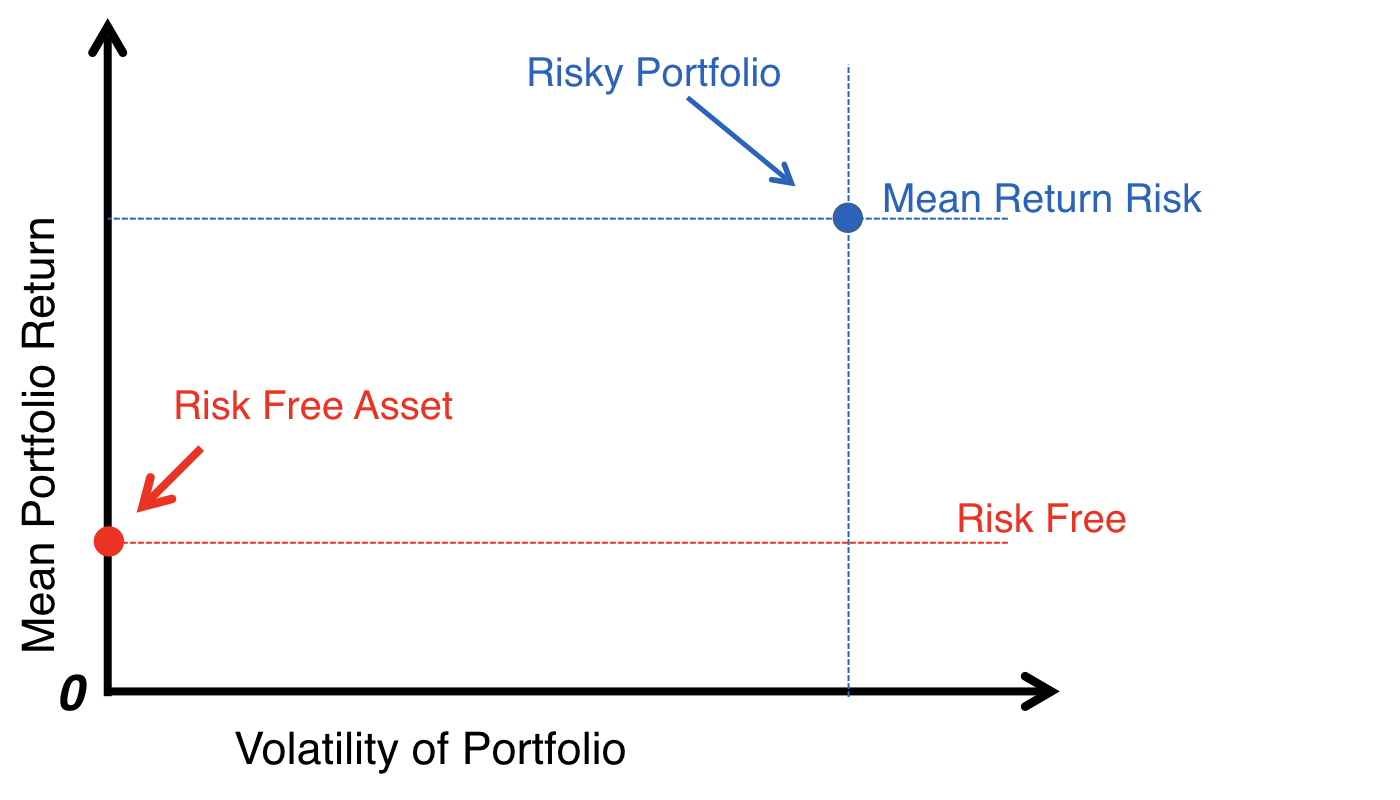
風險—報酬取捨
風險—報酬取捨
風險—報酬取捨
風險—報酬取捨
風險—報酬取捨
風險—報酬取捨
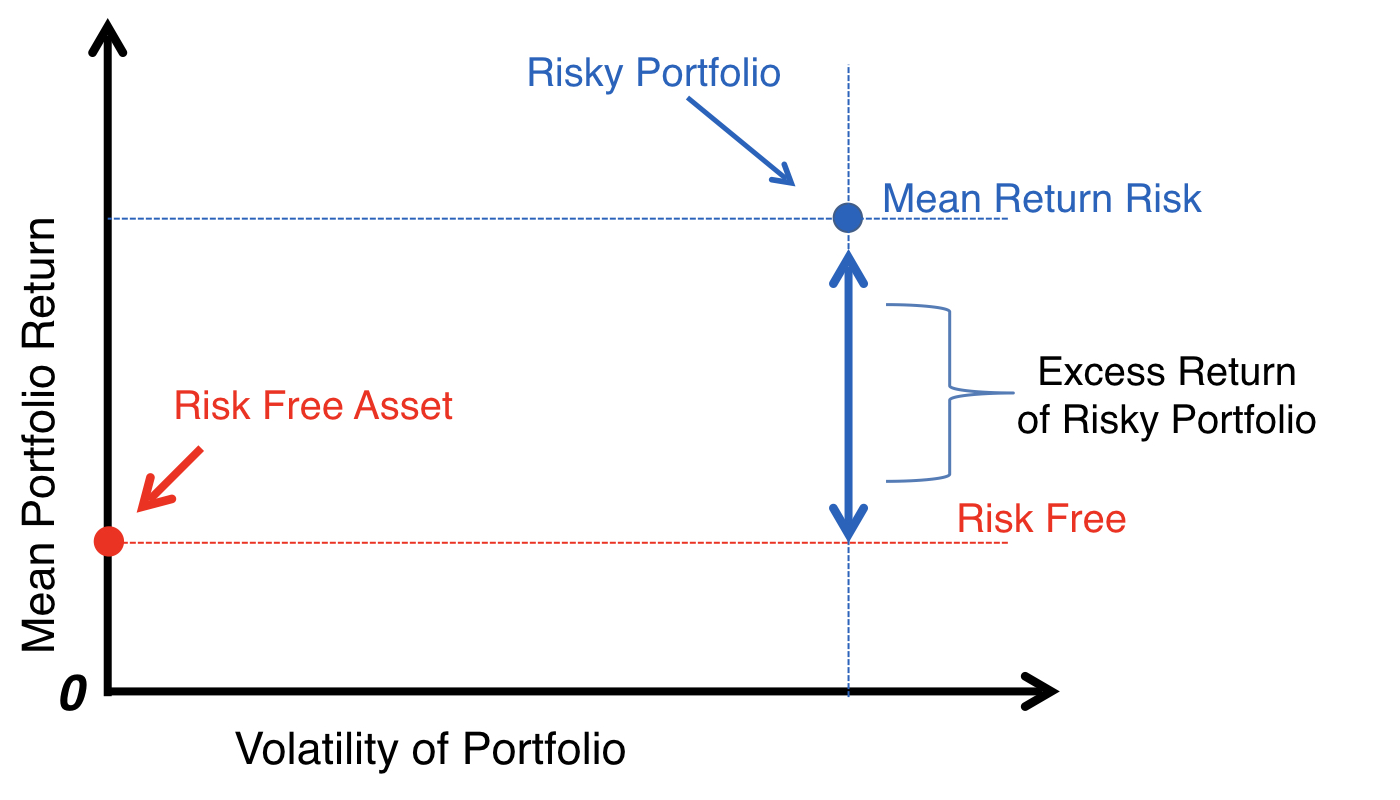
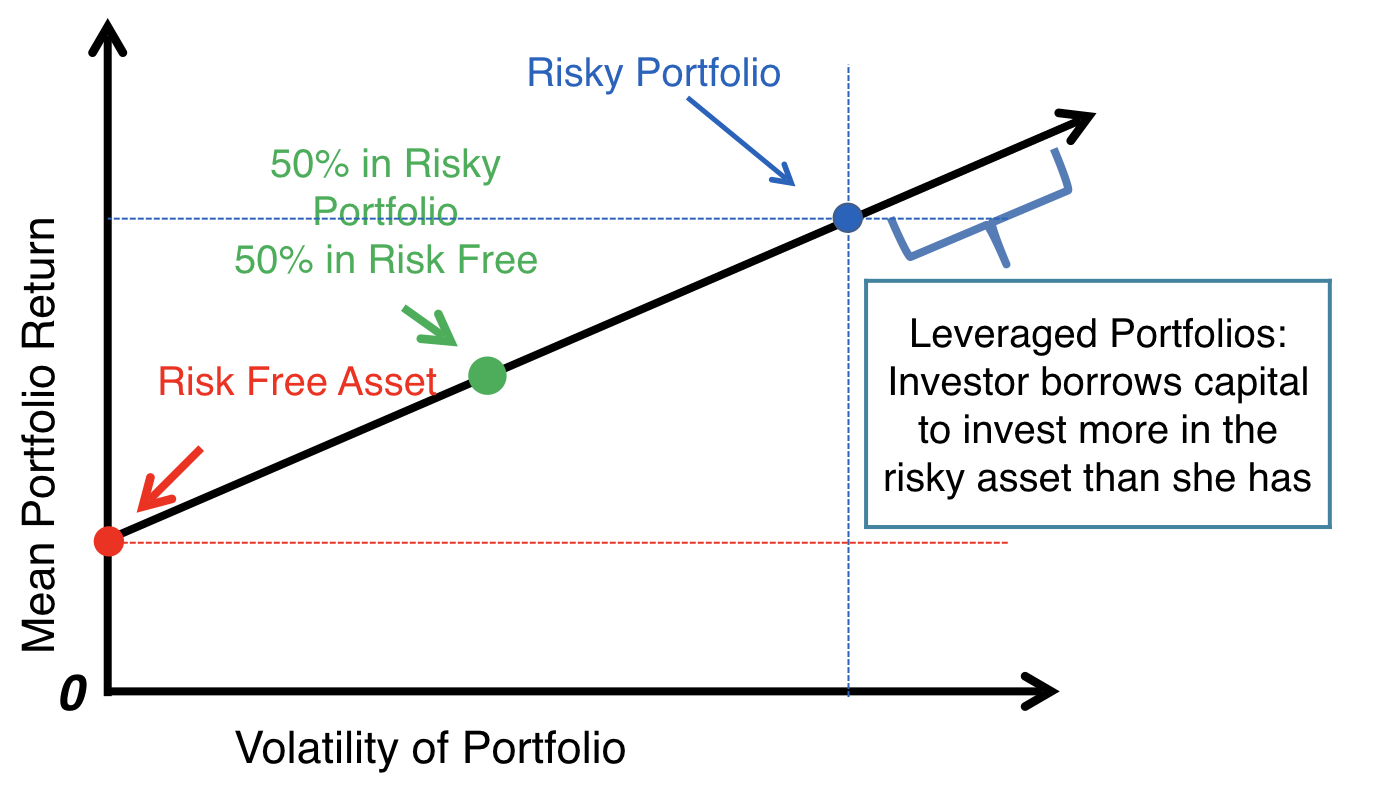
資本配置線
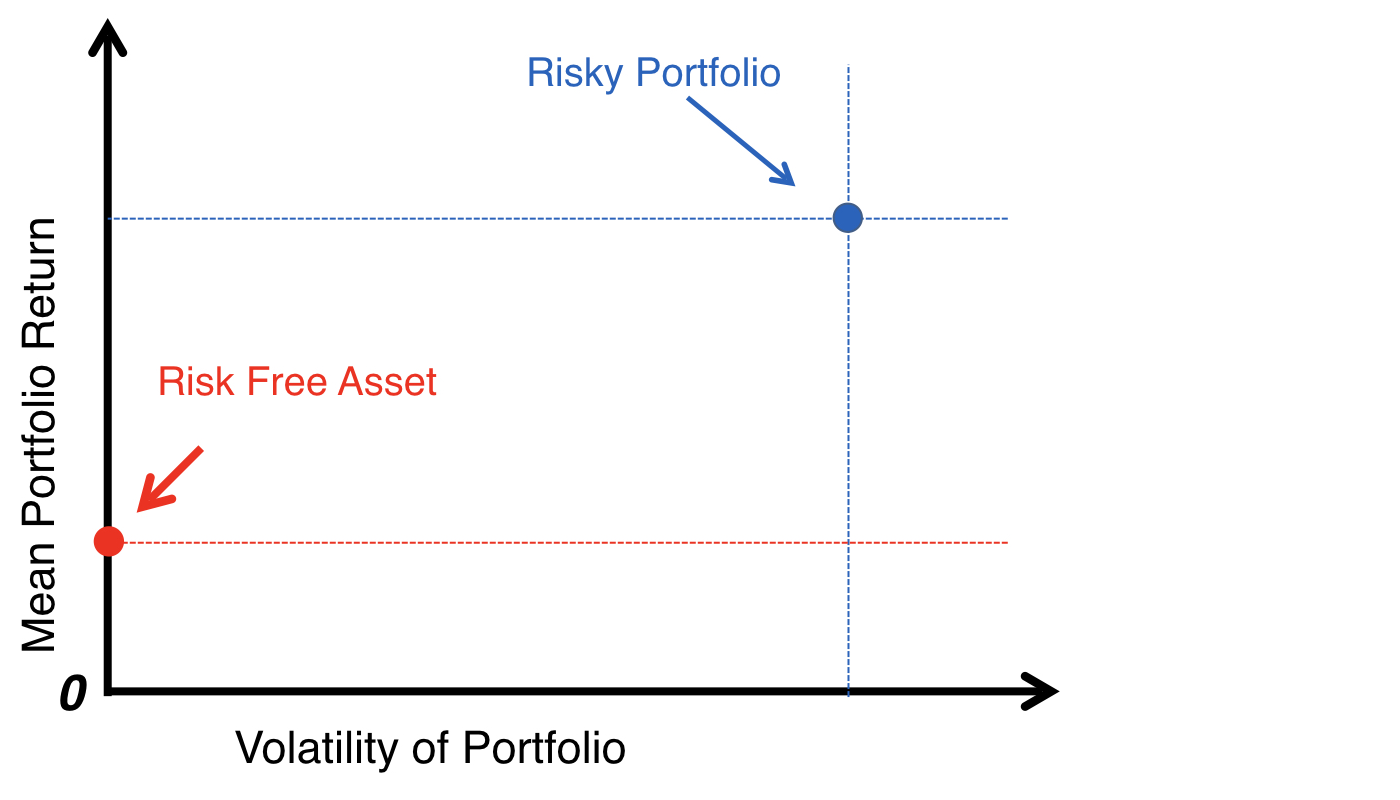
資本配置線
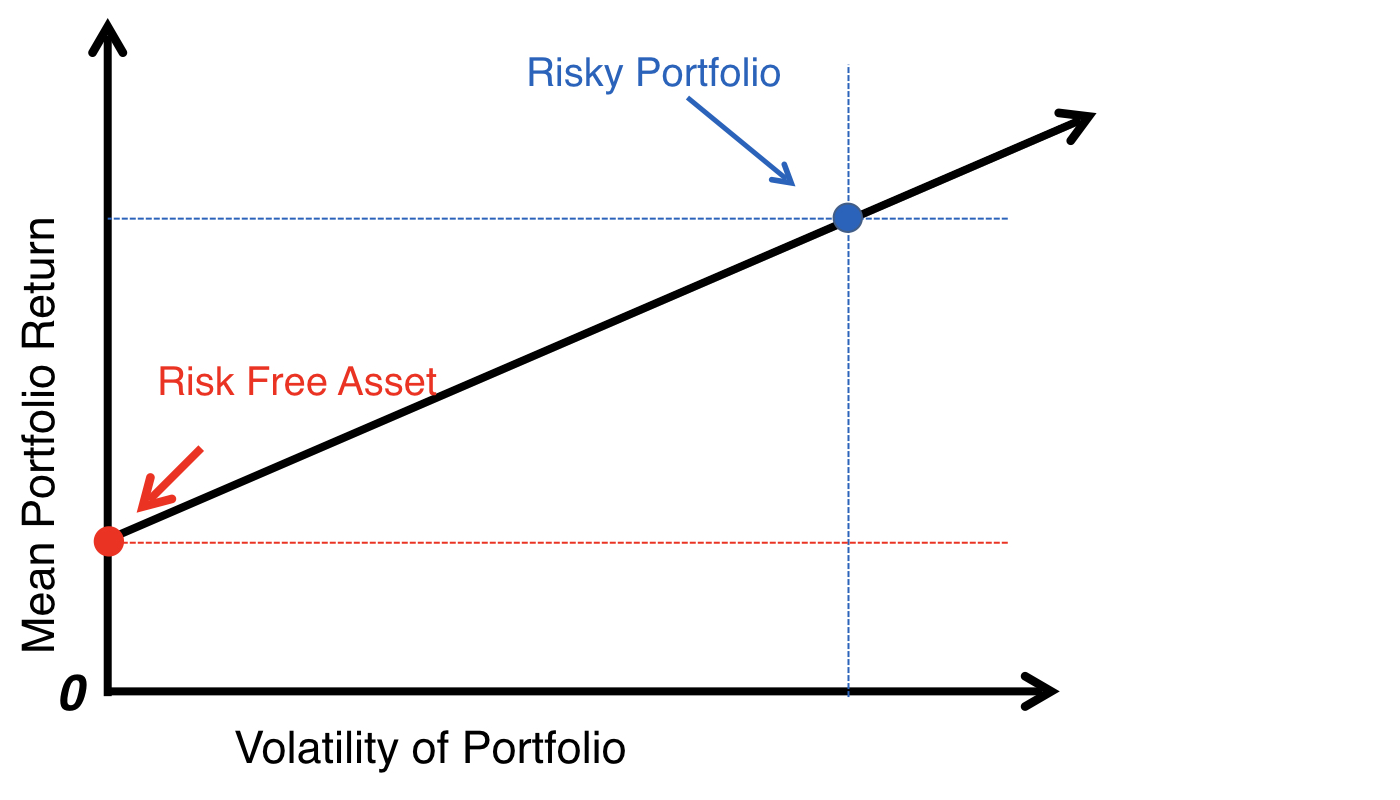
資本配置線
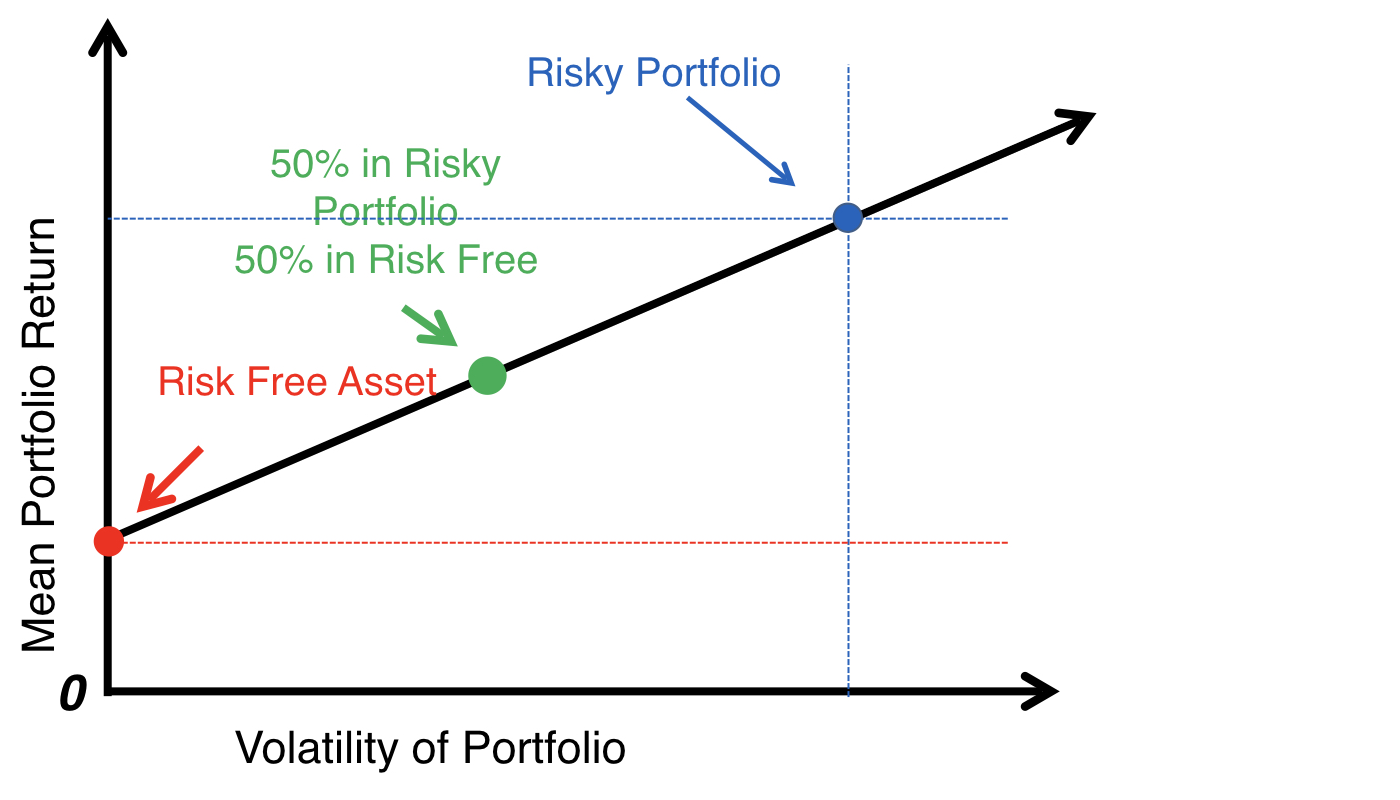
資本配置線
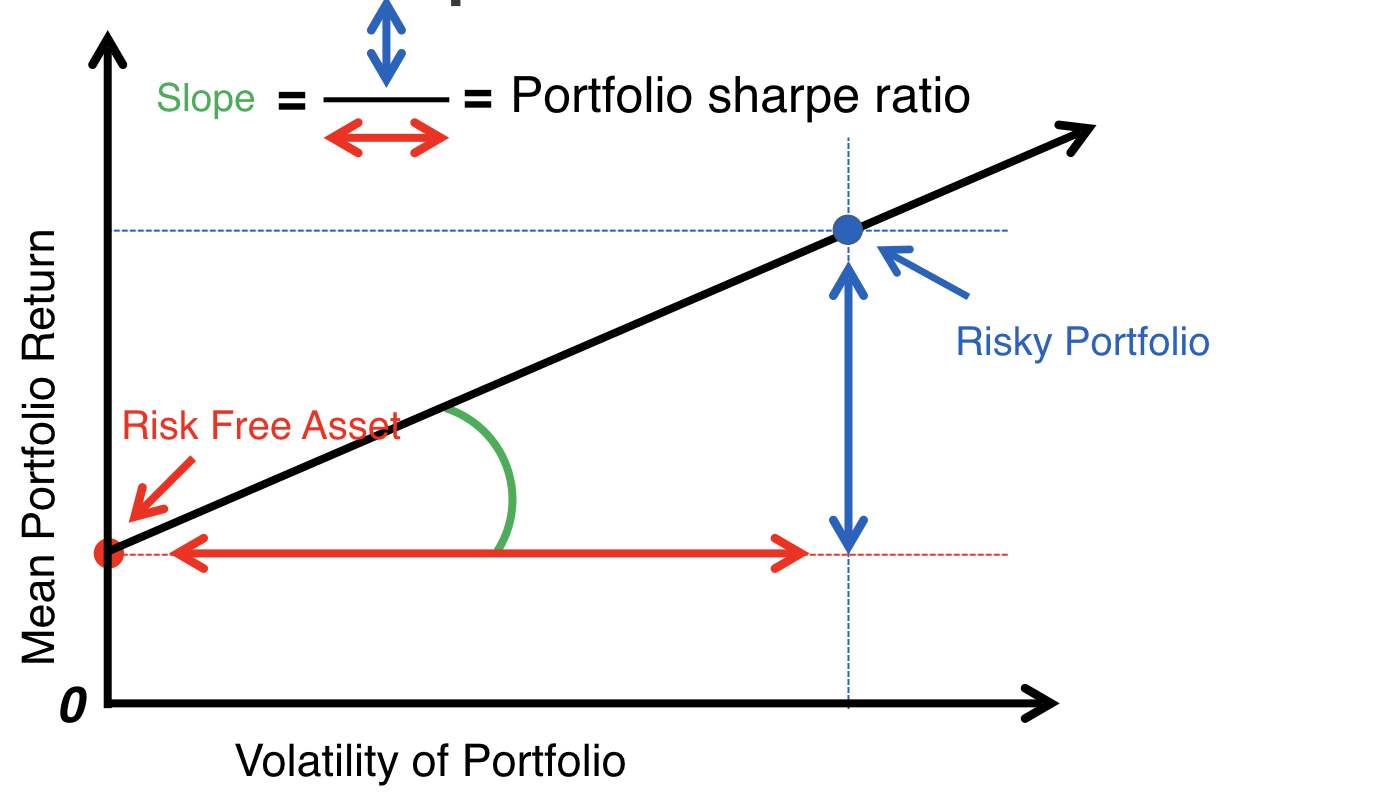
夏普比率
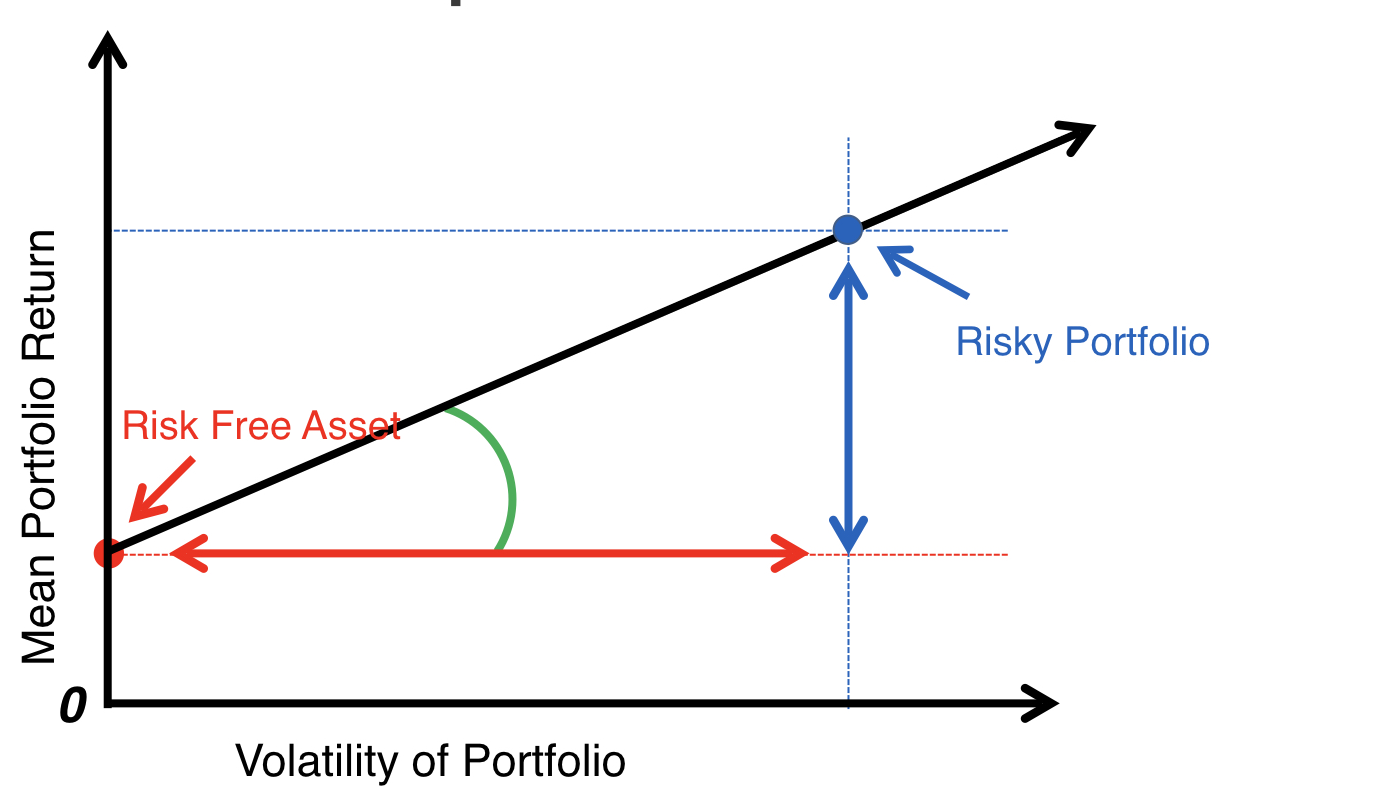
夏普比率
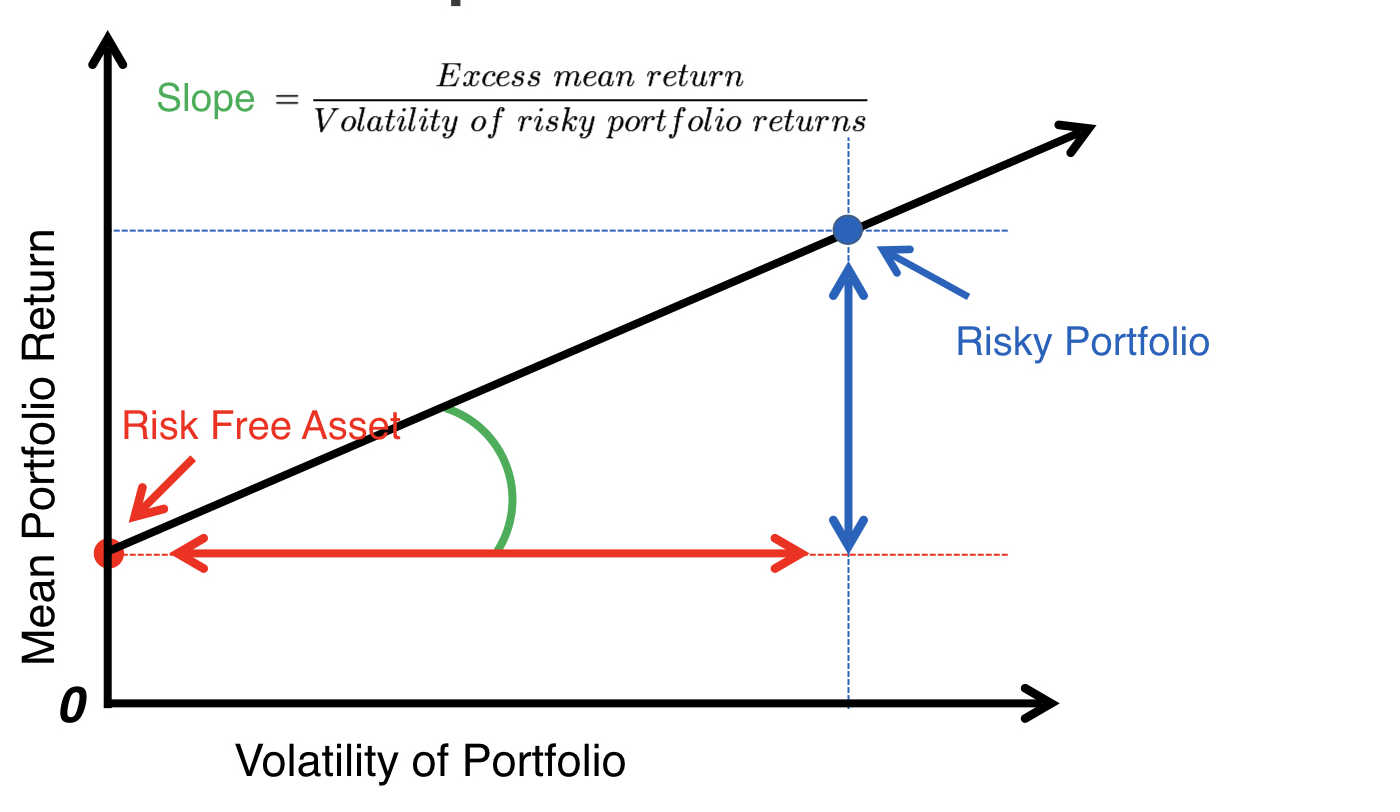
夏普比率
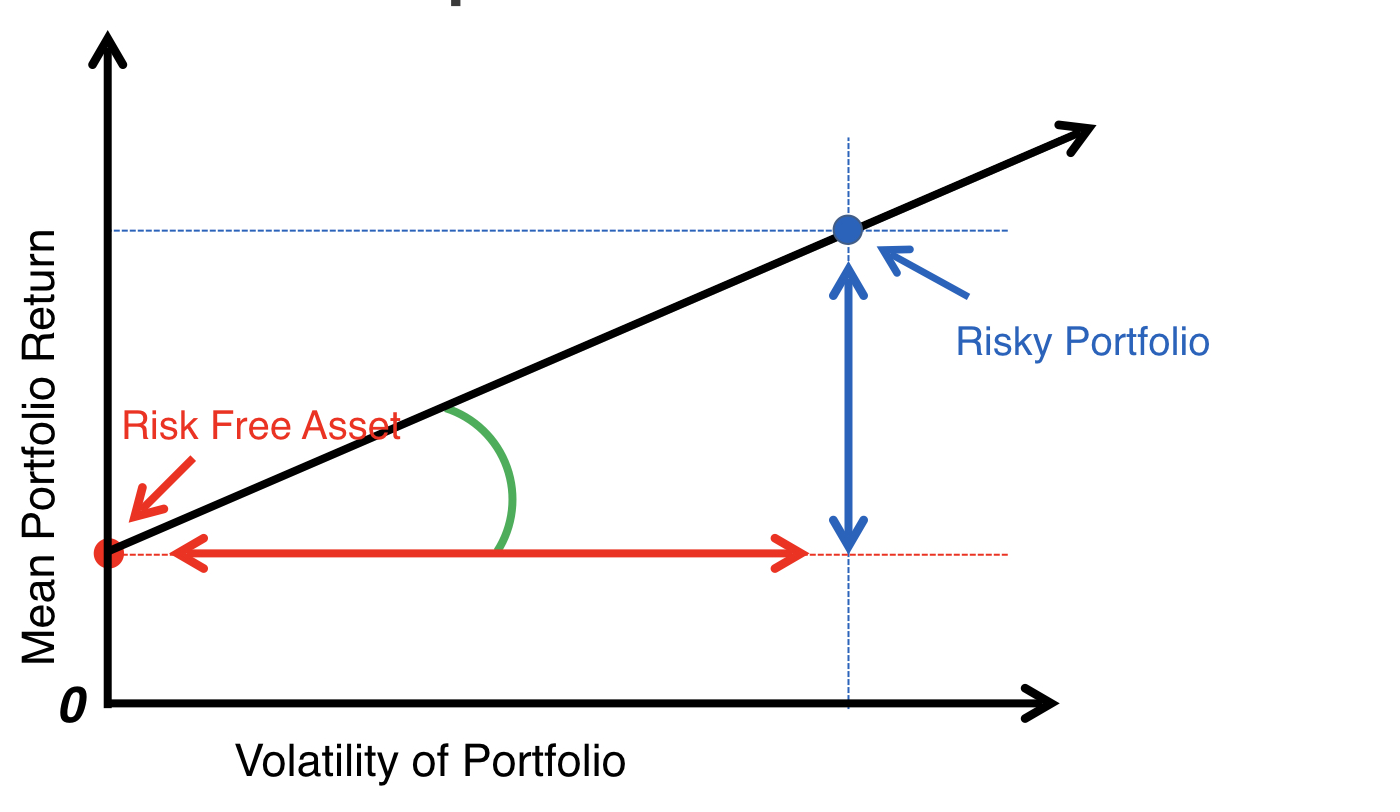
夏普比率
績效統計實作
library(PerformanceAnalytics)
sample_returns <- c(-0.02, 0.00, 0.00, 0.06, 0.02, 0.03, -0.01, 0.04)
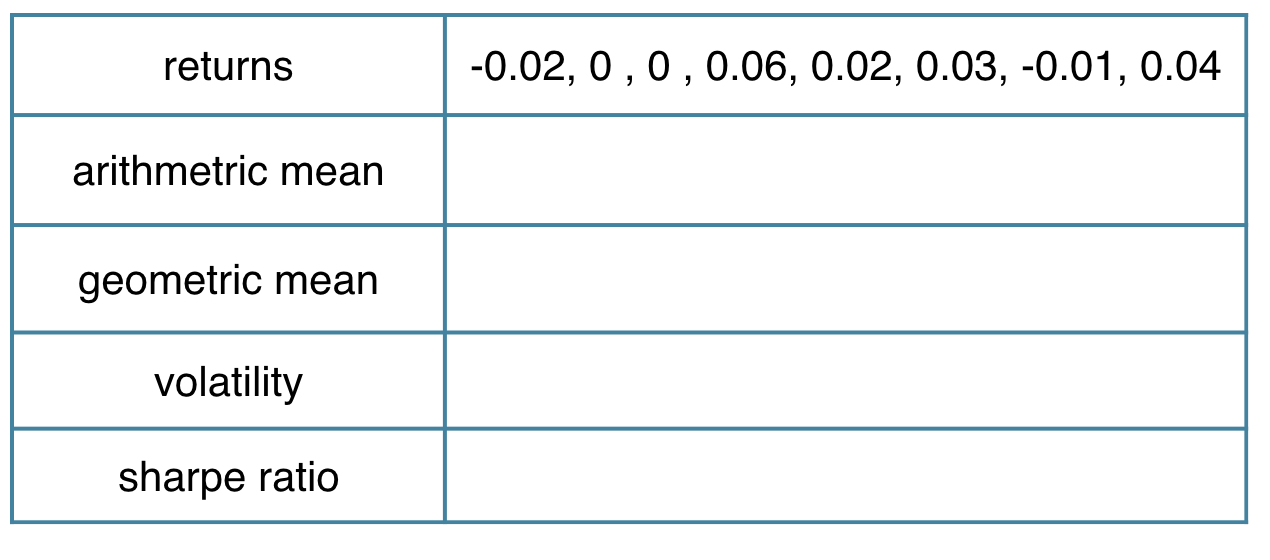
績效統計實作
library(PerformanceAnalytics)
sample_returns <- c(-0.02, 0.00, 0.00, 0.06, 0.02, 0.03, -0.01, 0.04)
mean(sample_returns)
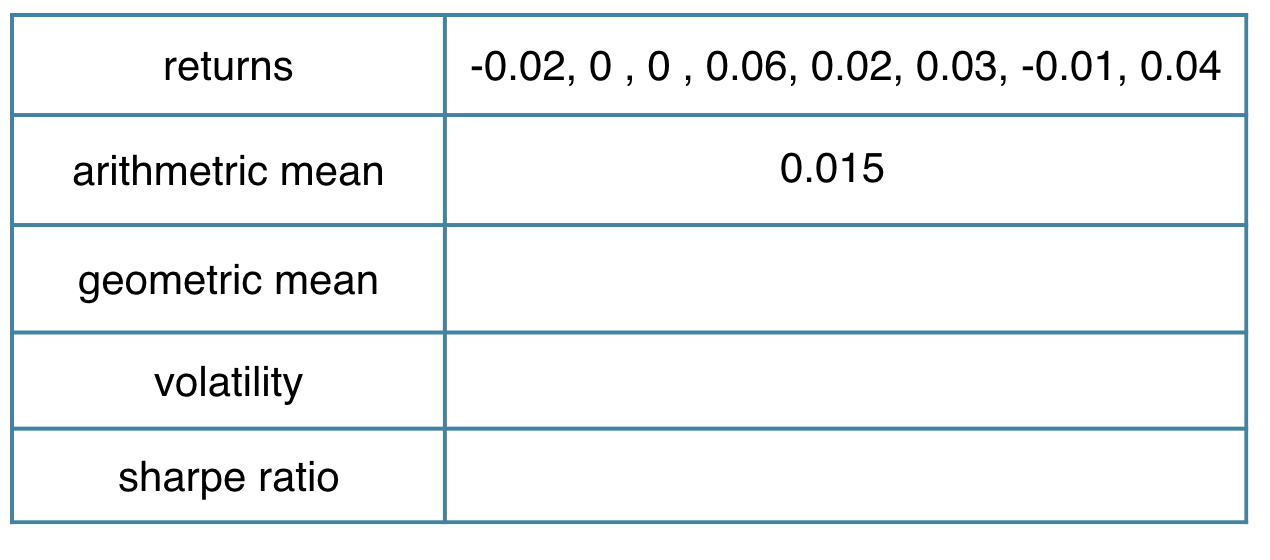
績效統計實作
library(PerformanceAnalytics)
sample_returns <- c(-0.02, 0.00, 0.00, 0.06, 0.02, 0.03, -0.01, 0.04)
mean.geometric(sample_returns)
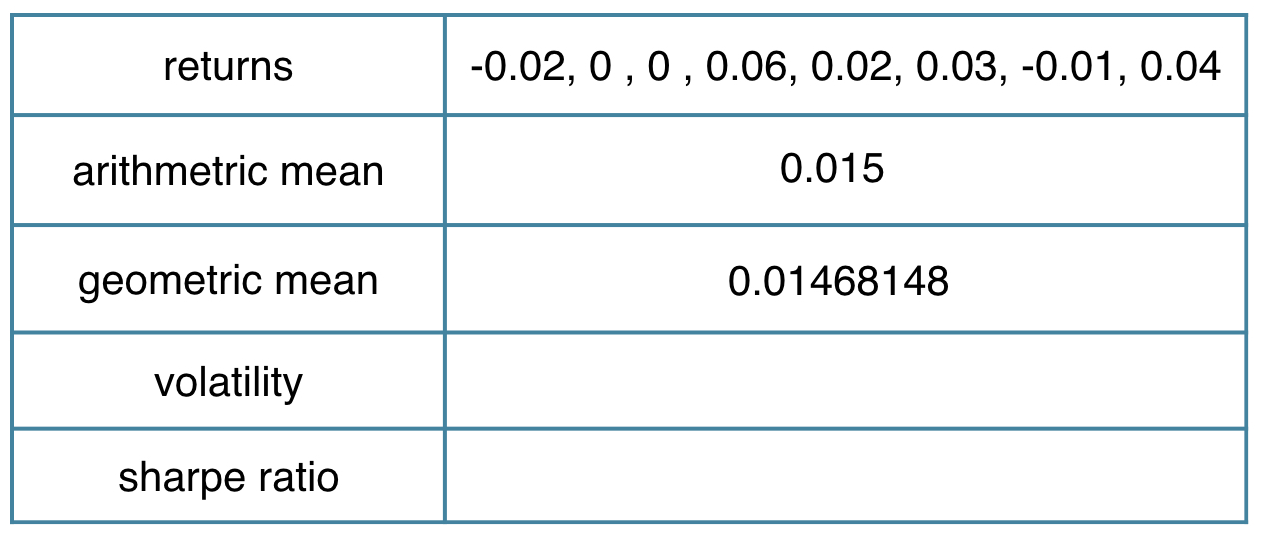
績效統計實作
library(PerformanceAnalytics)
sample_returns <- c(-0.02, 0.00, 0.00, 0.06, 0.02, 0.03, -0.01, 0.04)
StdDev(sample_returns)
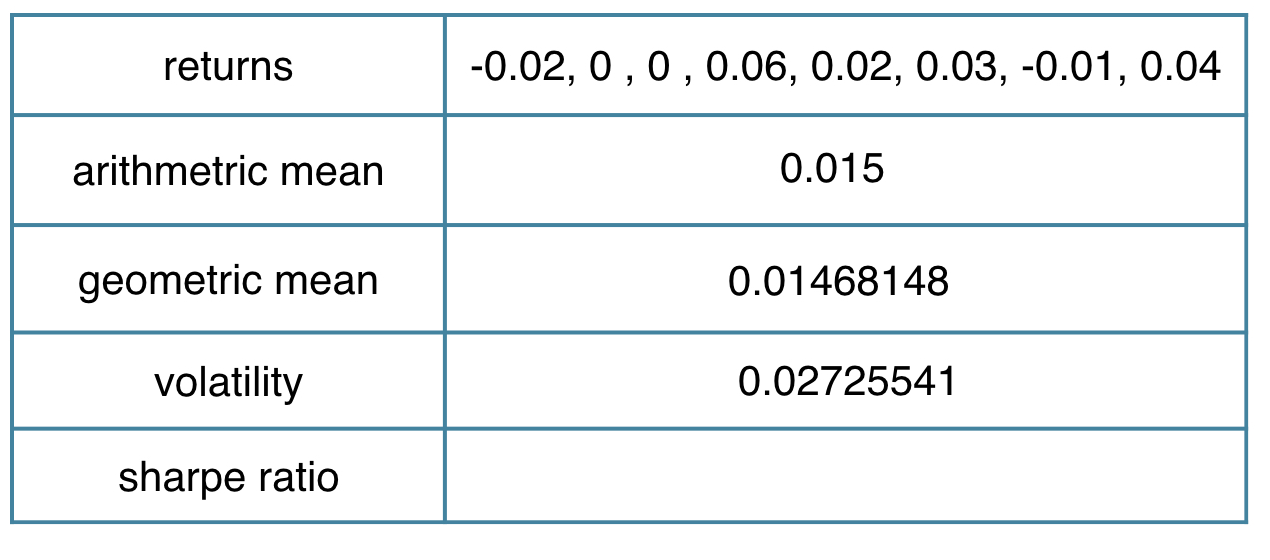
績效統計實作
library(PerformanceAnalytics)
sample_returns <- c(-0.02, 0.00, 0.00, 0.06, 0.02, 0.03, -0.01, 0.04)
(mean(sample_returns)-0.004)/StdDev(sample_returns)
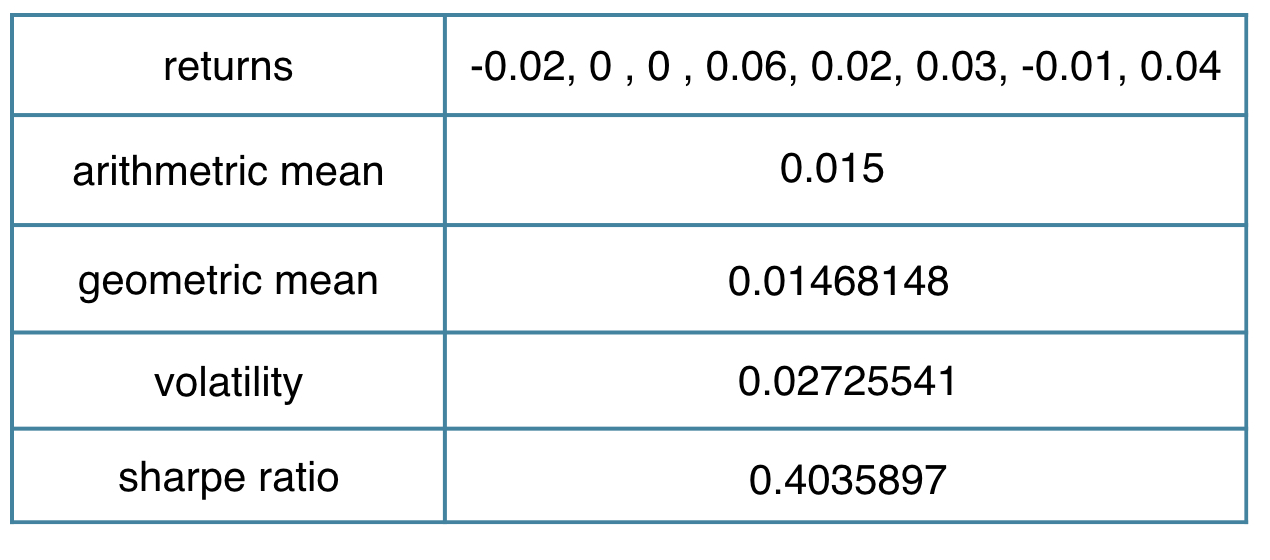
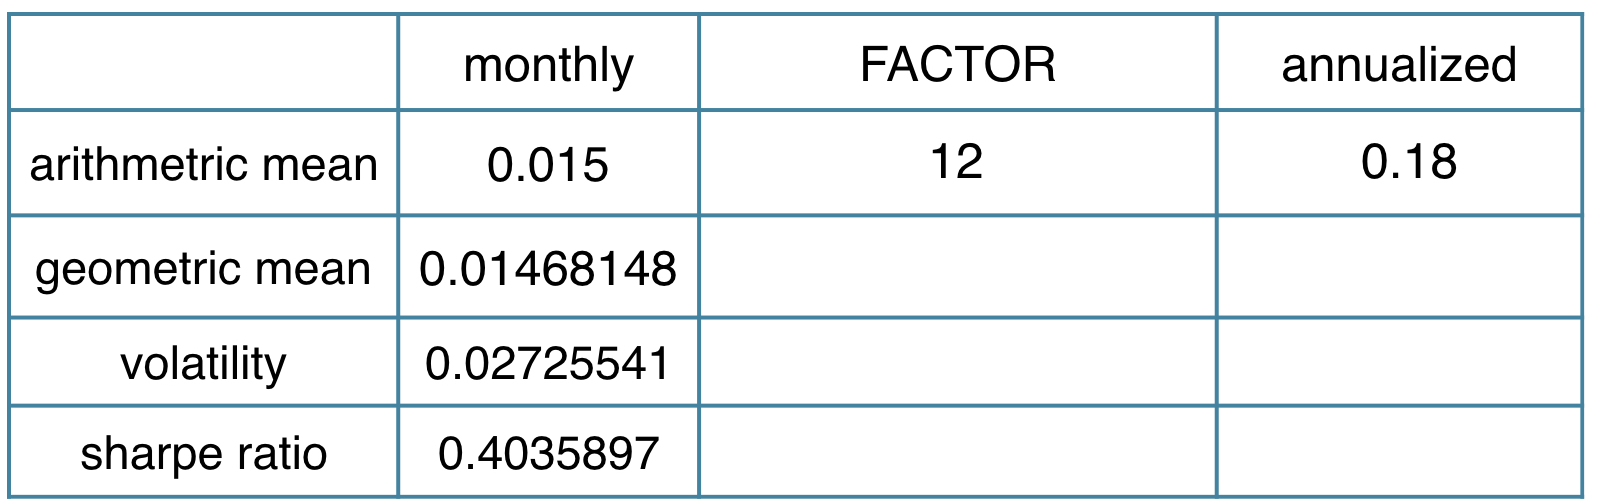
月度績效年化
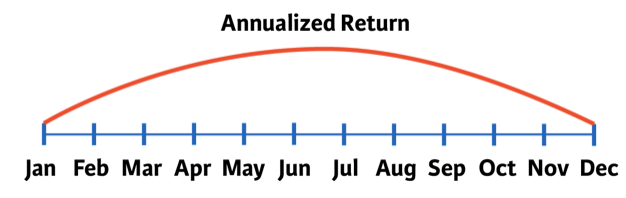
- 算術平均:月平均 * 12
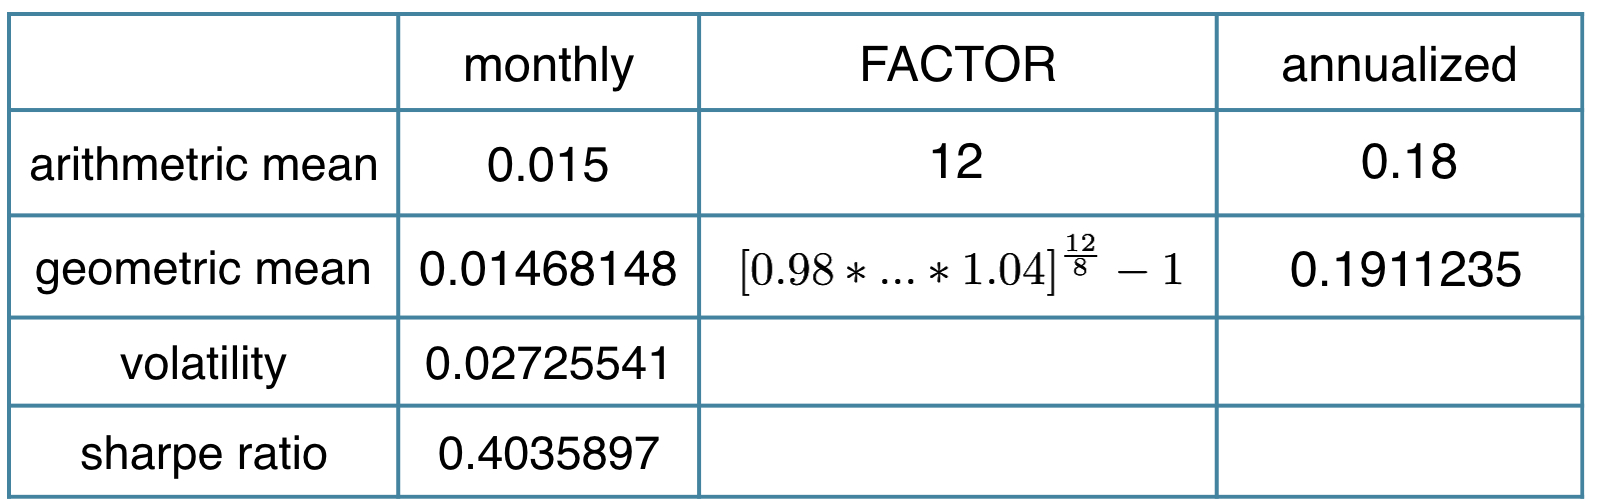
- 幾何平均($R_i$ 為月報酬):
- $[(1+R_1)\cdot(1+R_2)\cdot...\cdot(1+R_T)]^{12/T} -1$
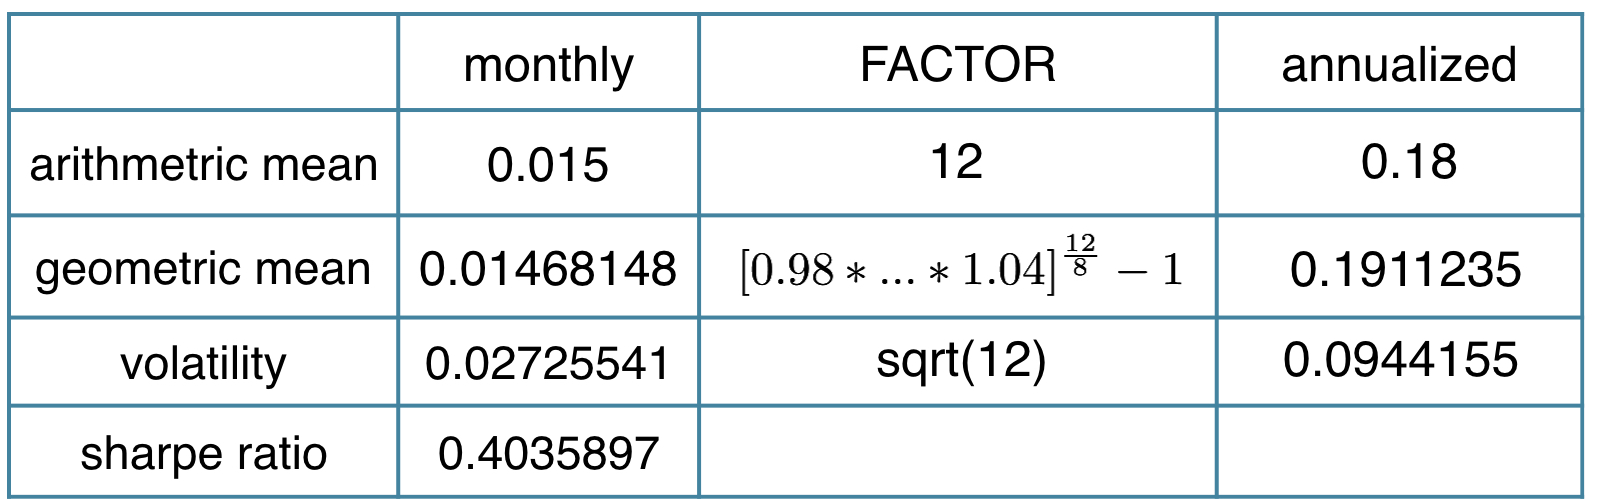
- 波動度:月波動度 * sqrt(12)
績效統計實作
library(PerformanceAnalytics)
sample_returns <- c( -0.02, 0.00, 0.00, 0.06, 0.02, 0.03, -0.01, 0.04)
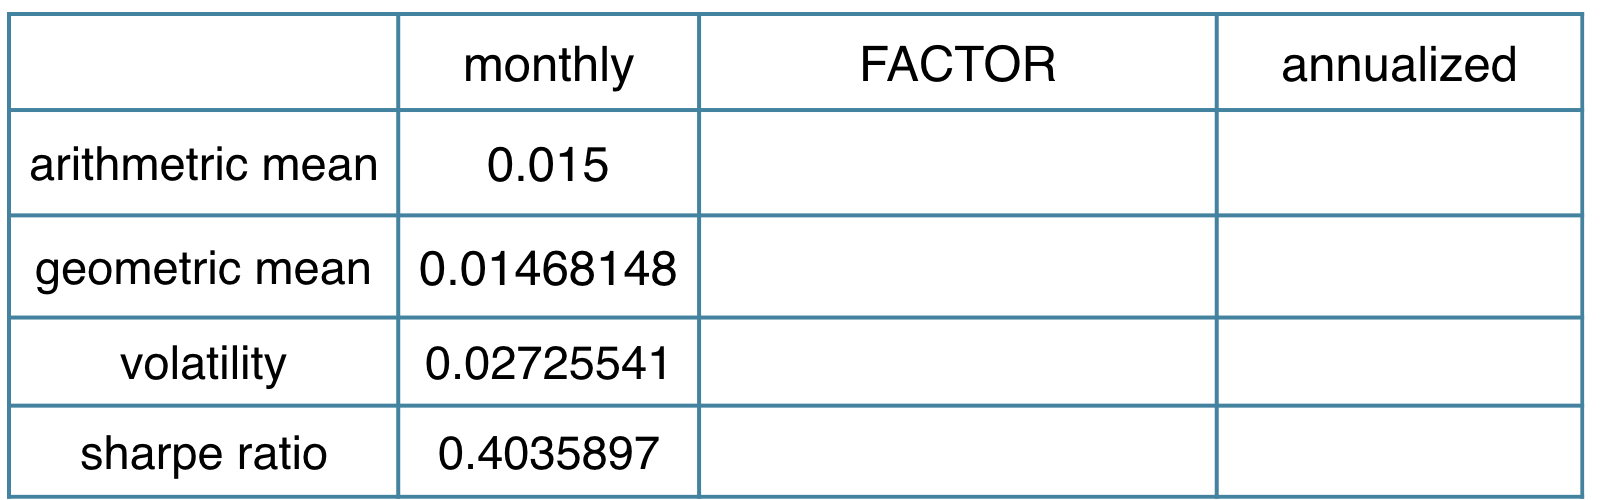
績效統計實作
library(PerformanceAnalytics)
sample_returns <- c( -0.02, 0.00, 0.00, 0.06, 0.02, 0.03, -0.01, 0.04)
Return.annualized(sample_returns, scale = 12, geometric = FALSE)
績效統計實作
library(PerformanceAnalytics)
sample_returns <- c( -0.02, 0.00, 0.00, 0.06, 0.02, 0.03, -0.01, 0.04)
Return.annualized(sample_returns, scale = 12, geometric = TRUE)
績效統計實作
library(PerformanceAnalytics)
sample_returns <- c( -0.02, 0.00, 0.00, 0.06, 0.02, 0.03, -0.01, 0.04)
Std.Dev.annualized(sample_returns, scale = 12)
績效統計實作
library(PerformanceAnalytics)
sample_returns <- c( -0.02, 0.00, 0.00, 0.06, 0.02, 0.03, -0.01, 0.04)
Return.annualized(sample_returns, scale = 12)/
    Std.Dev.annualized(sample_returns, scale = 12)