差異性結合入門

在 R 中使用 Bioconductor 進行 ChIP-seq

Peter Humburg

Statistician, Macquarie University
在 R 中使用 Bioconductor 進行 ChIP-seq

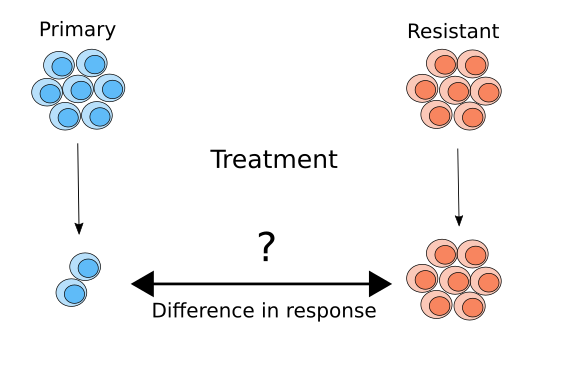
比較樣本

  • 兩組樣本:原發腫瘤與抗藥性腫瘤。

想回答的問題:

  • 同組樣本是否整體相似?
  • 不同組樣本是否有差異?
  • 差異是什麼?
在 R 中使用 Bioconductor 進行 ChIP-seq

在 R 中使用 Bioconductor 進行 ChIP-seq

在 R 中使用 Bioconductor 進行 ChIP-seq

在 R 中使用 Bioconductor 進行 ChIP-seq

在 R 中使用 Bioconductor 進行 ChIP-seq

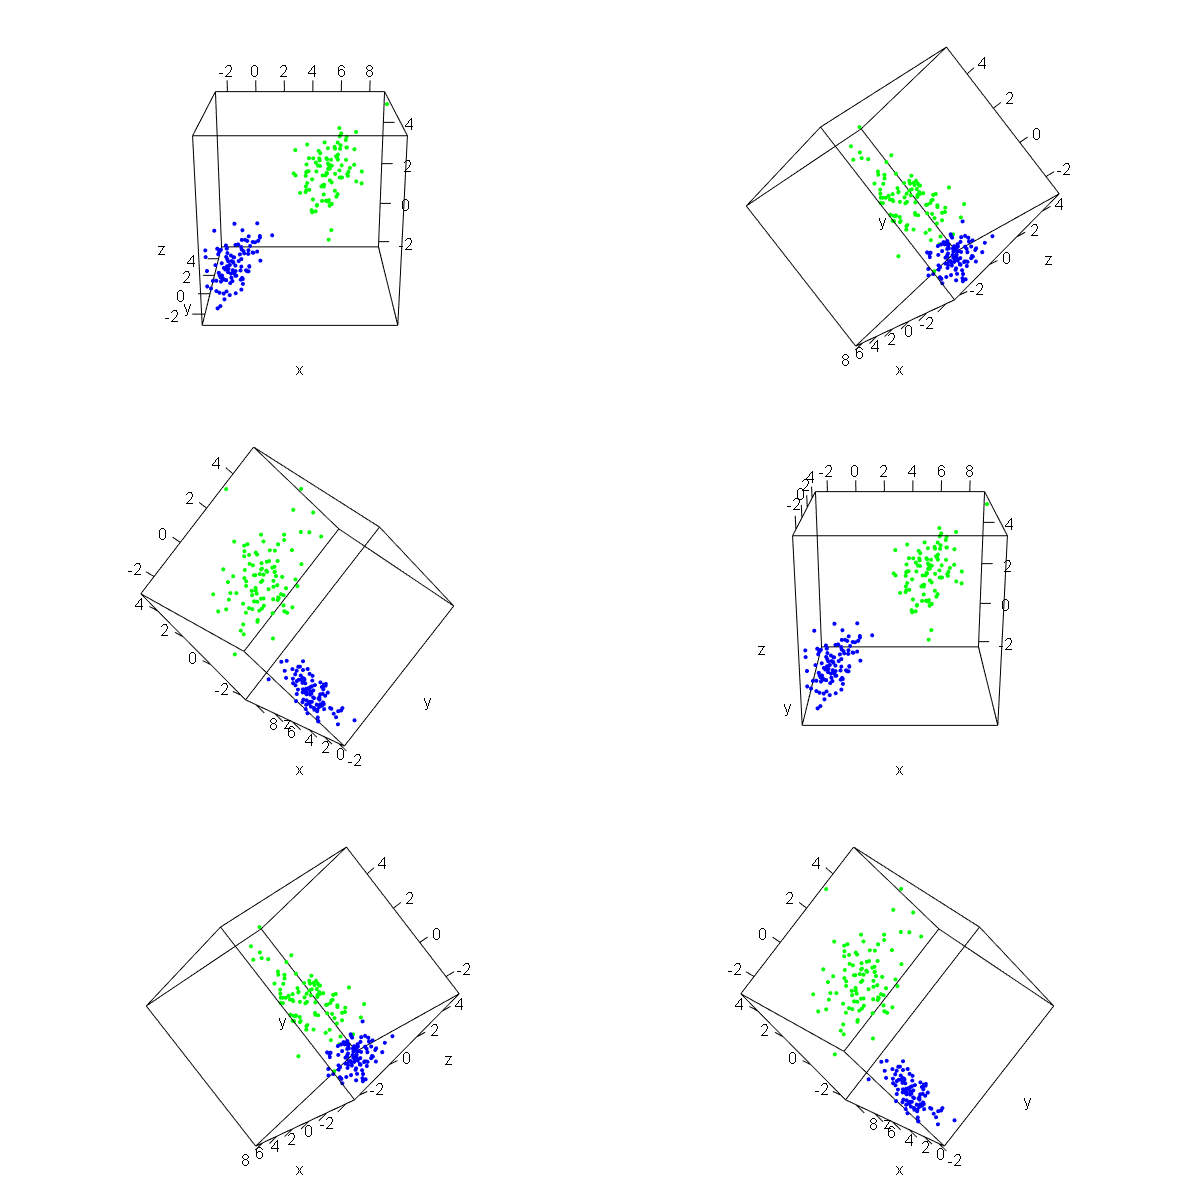
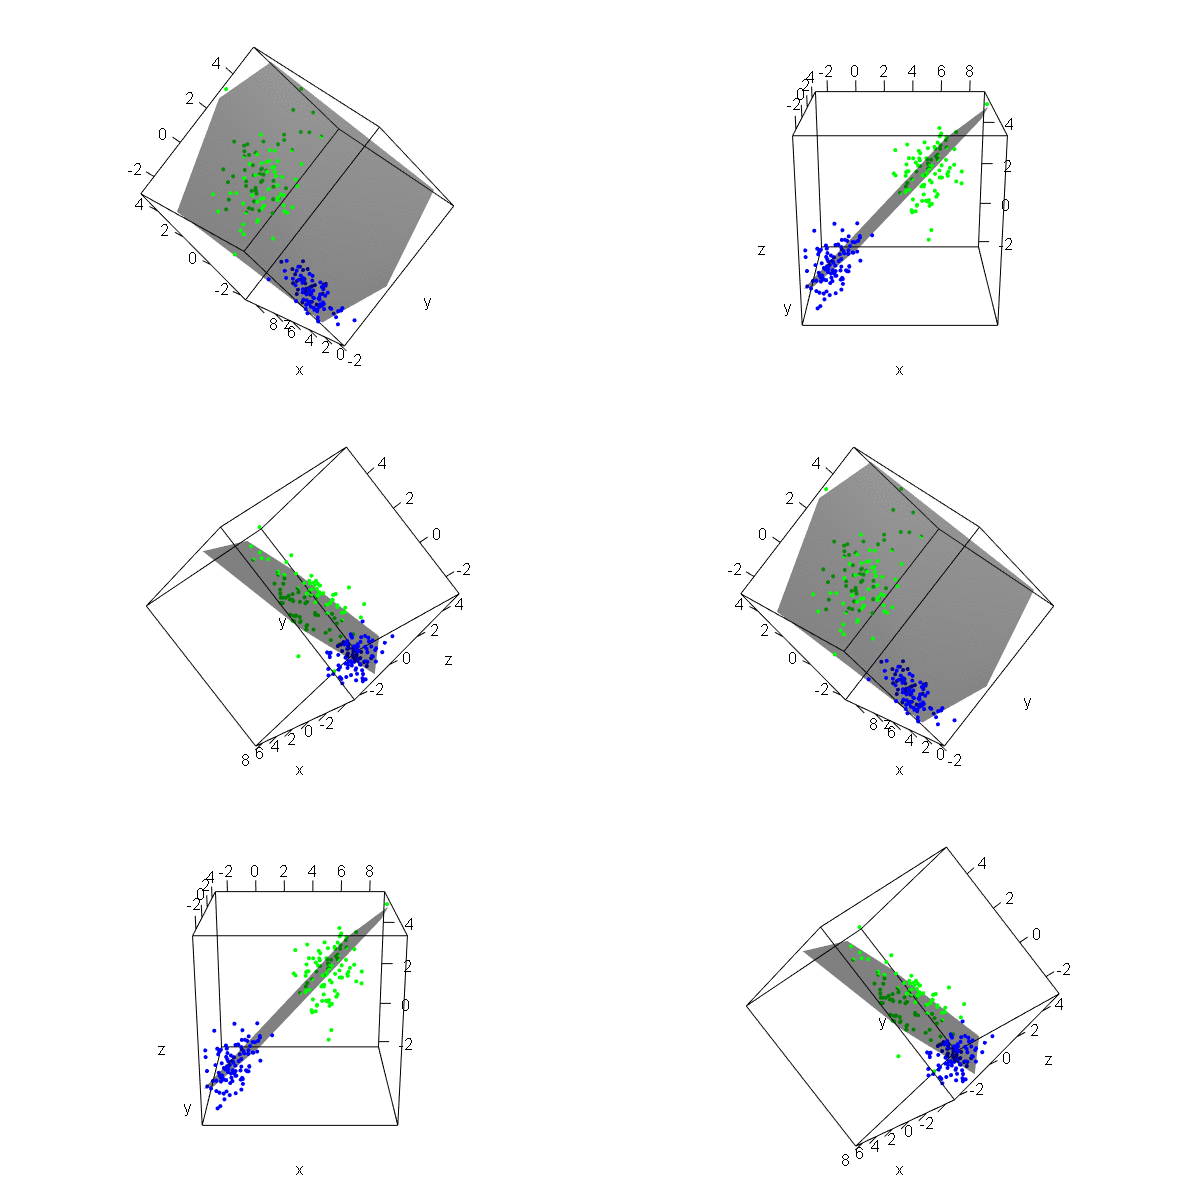
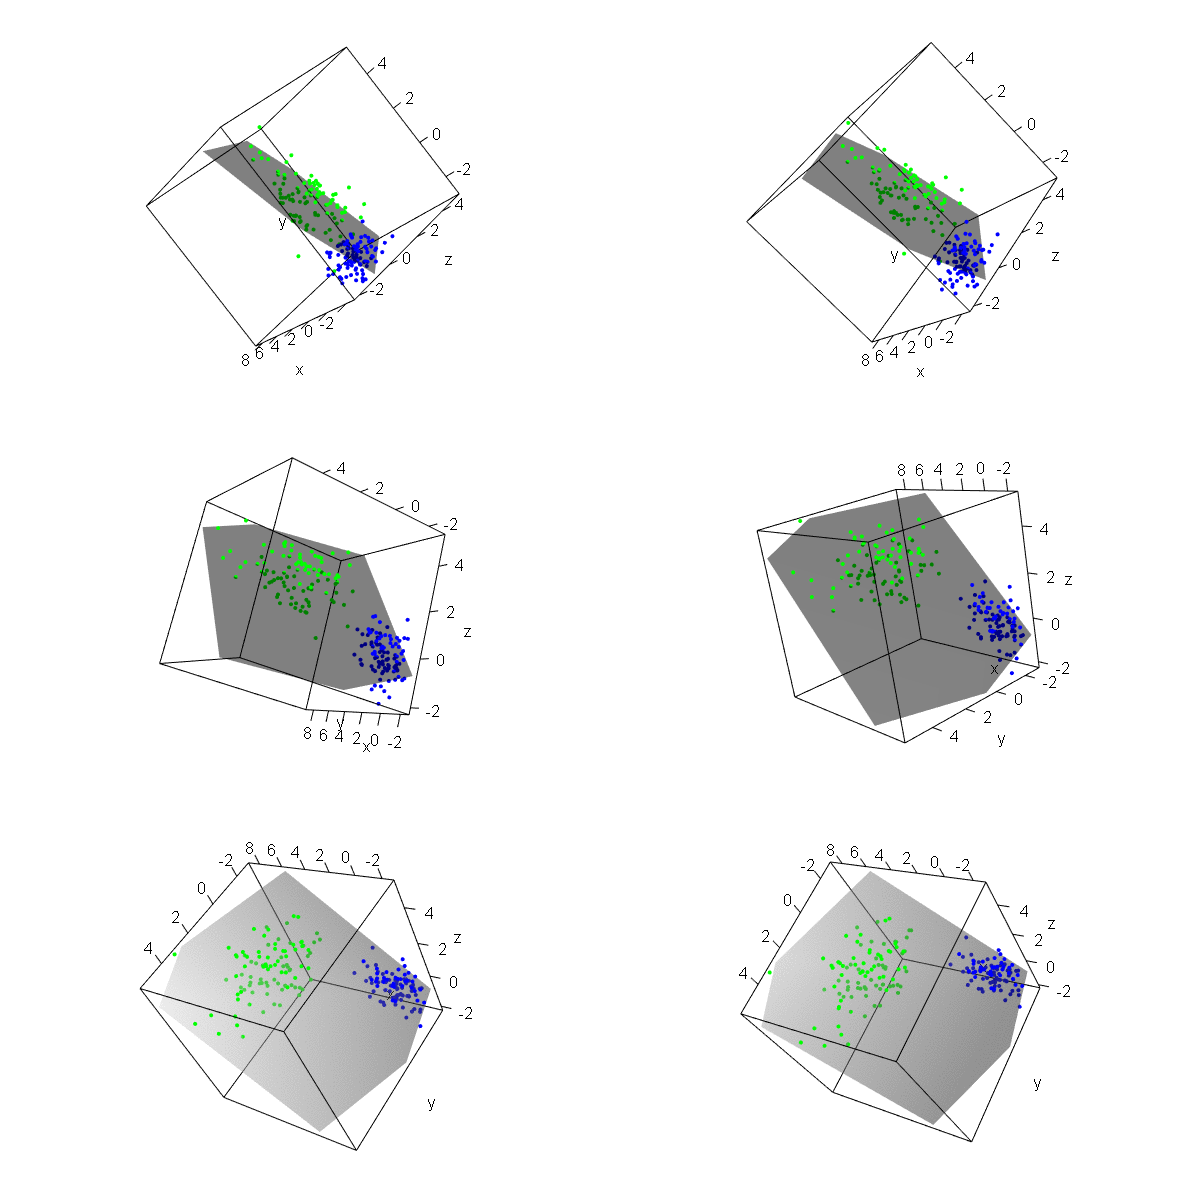
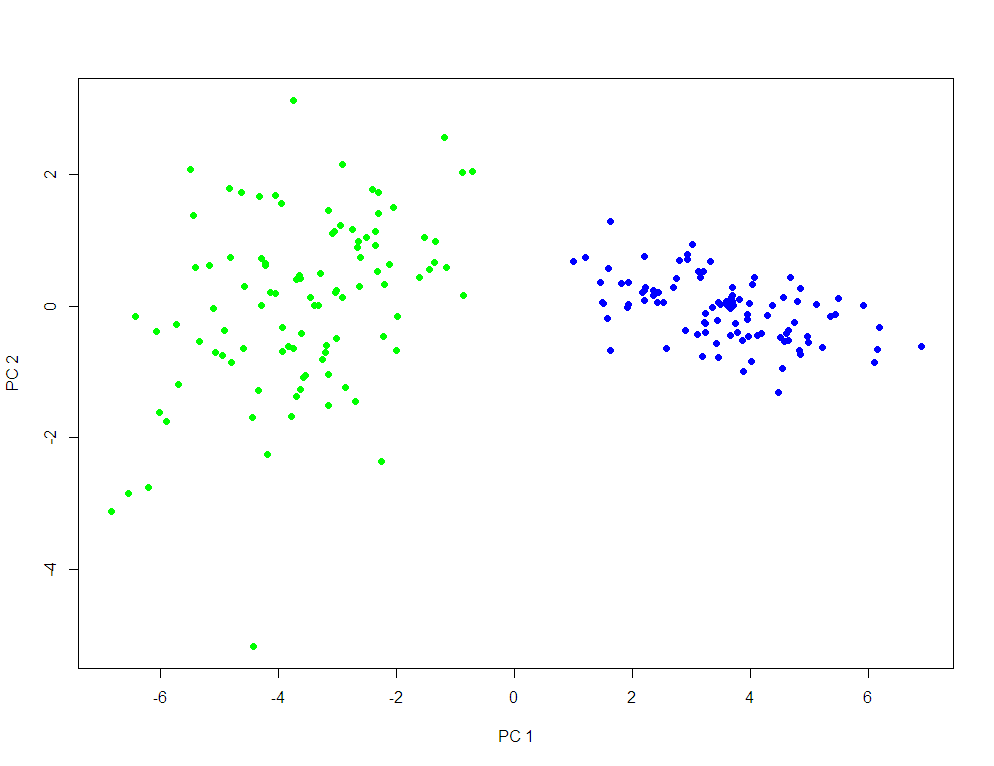
ChIP-seq 的 PCA 圖

qc_result <- ChIPQC("sample_info.csv", "hg19")
counts <- dba.count(qc_results, summits=250)
plotPrincomp(counts)
在 R 中使用 Bioconductor 進行 ChIP-seq

階層式分群

計算樣本間距離

distance <- dist(t(coverage))

建立樹狀圖

dendro <- hclust(distance)

繪製樹狀圖

plot(dendro)
在 R 中使用 Bioconductor 進行 ChIP-seq

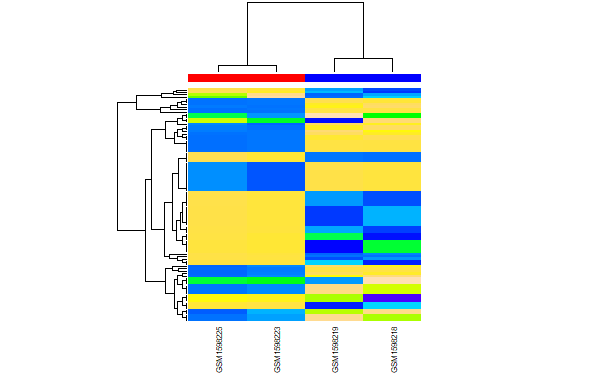
熱圖

以峰值的 coverage 資料建立熱圖

dba.plotHeatmap(peaks, maxSites = peak_count, correlations = FALSE)
在 R 中使用 Bioconductor 進行 ChIP-seq

一起來練習吧!

在 R 中使用 Bioconductor 進行 ChIP-seq

Preparing Video For Download...