HR 分析:用 R 探索員工資料
Ben Teusch
HR Analytics Consultant
library(tidyr)

data %>%
    gather(columns,
           key = "key", value = "value")
survey_summary
# A tibble: 3 × 3
  department  average_engagement average_promotions
  <chr>                    <dbl>              <dbl>
1 Engineering               3.15              0.478
2 Finance                   3.24              0.540
3 Sales                     2.81              0.491
survey_summary %>%
  gather(average_engagement,
         average_promotions,
         key = "key",
         value = "value")
# A tibble: 6 × 3
  department  key                value
  <chr>       <chr>              <dbl>
1 Engineering average_engagement 3.15
2 Finance     average_engagement 3.24
3 Sales       average_engagement 2.81
4 Engineering average_promotions 0.478
5 Finance     average_promotions 0.540
6 Sales       average_promotions 0.491
survey_gathered <- survey_summary %>%
  gather(average_engagement, average_promotions,
         key = "key", value = "value")

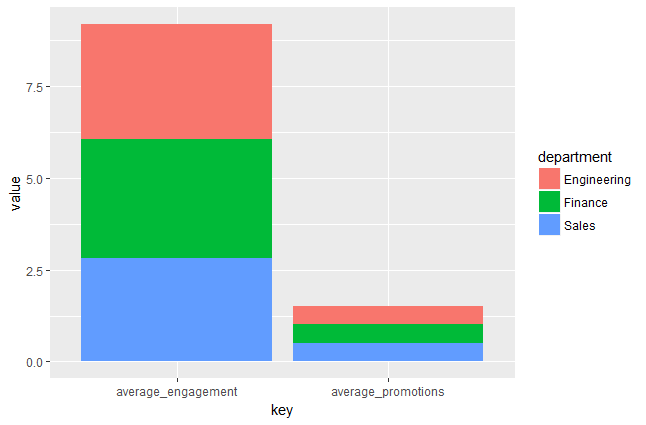
ggplot(survey_gathered, aes(key, value, fill = department)) +
  geom_col()
survey_gathered <- survey_summary %>% gather(average_engagement, average_promotions, key = "key", value = "value")
ggplot(survey_gathered, aes(key, value, fill = department)) + geom_col()
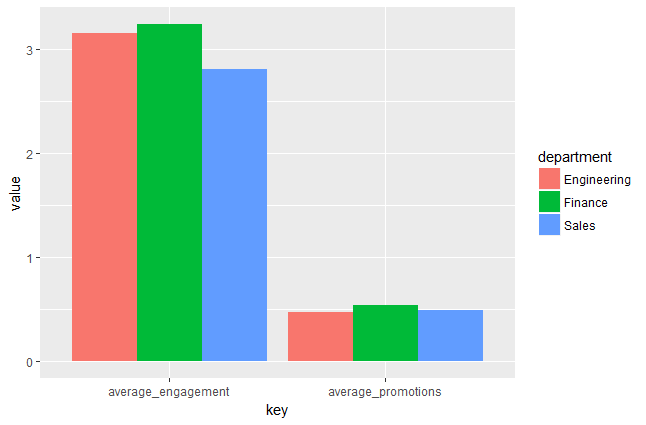
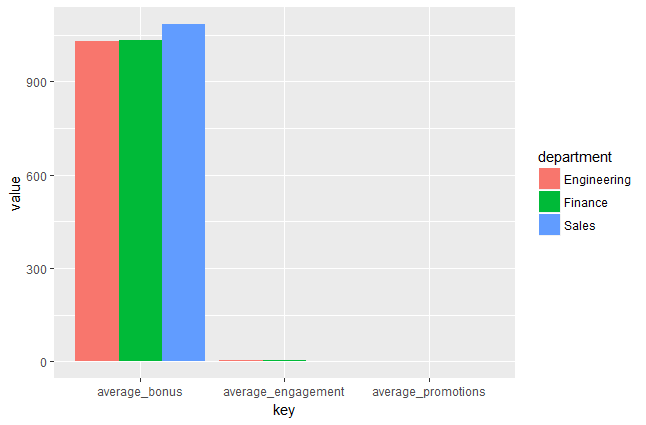
ggplot(survey_gathered, aes(key, value, fill = department)) +
  geom_col(position = "dodge")
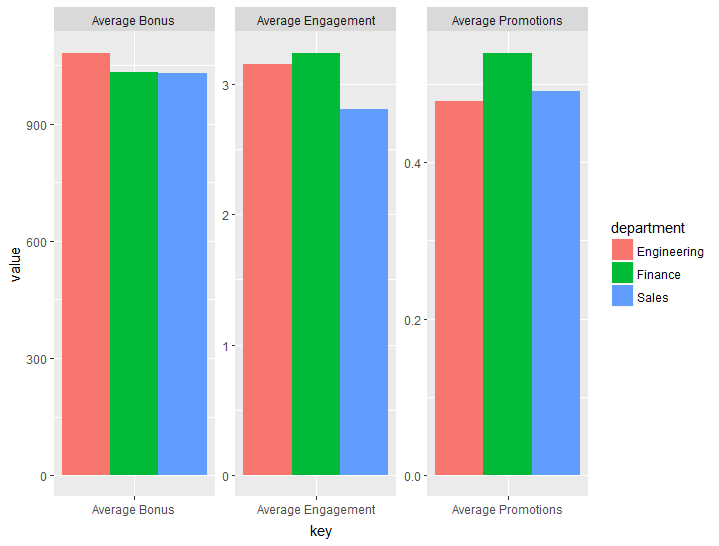
ggplot(survey_gathered, aes(x = key,
                            y = value,
                            fill = department)) +
  geom_col(position = "dodge") +
  facet_wrap(~ key, scales = "free")