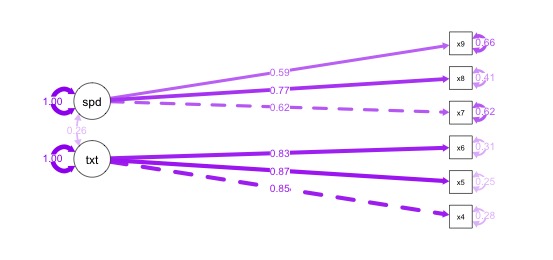
使用 semPaths() 建立圖形
在 R 中使用 lavaan 的結構方程模型

Erin Buchanan
Professor
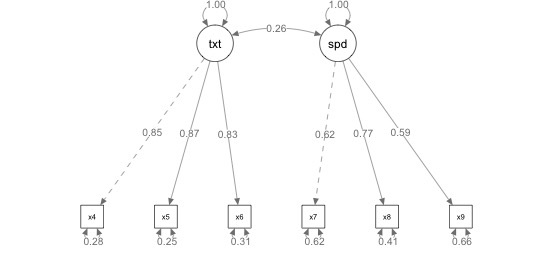
semPaths() 的預設輸出

編修圖形
semPaths(object = twofactor.fit,
         whatLabels = "std",
         edge.label.cex = 1)
#whatLabels 也可用 "par"
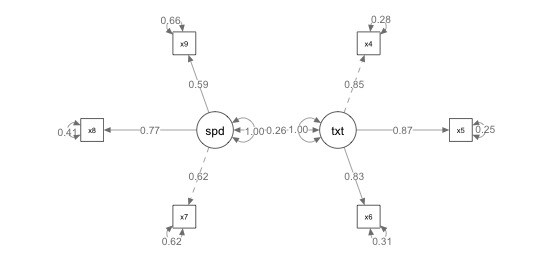
圖形版面
semPaths(object = twofactor.fit,
          whatLabels = "std",
          edge.label.cex = 1,
          layout = "circle")
#layout 選項:tree、circle、spring、tree2、circle2
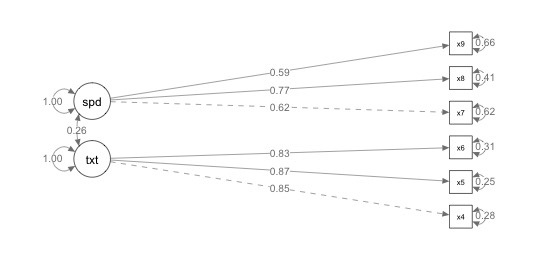
圖形旋轉
semPaths(object = twofactor.fit,
          whatLabels = "std",
          edge.label.cex = 1,
          layout = "tree", rotation = 2)
#tree 版面的 rotation 選項為 1、2、3、4
色彩視覺化
semPaths(object = twofactor.fit,
         whatLabels = "std",
         edge.label.cex = 1,
         layout = "tree", rotation = 2,
         what = "std", edge.color = "purple")
#what 選項包含 par 與 std