在 Python 中使用 Dask 進行平行程式設計
James Fulton
Climate Informatics Researcher
import xarray as xr
ds = xr.open_zarr("data/era_eu.zarr")


print(ds)
import xarray as xr ds = xr.open_zarr("data/era_eu.zarr")
print(ds)
<xarray.Dataset>
Dimensions:  (lat: 30, lon: 45, time: 504)
Coordinates:
  * lat      (lat) float64 35.5 36.5 37.5 38.5 39.5 ... 60.5 61.5 62.5 63.5 64.5
  * lon      (lon) float64 -14.5 -13.5 -12.5 -11.5 -10.5 ... 26.5 27.5 28.5 29.5
  * time     (time) datetime64[ns] 1979-05-31 1979-06-30 ... 2021-04-30
Data variables:
    precip   (time, lat, lon) float32 dask.array<chunksize=(12, 15, 15), ... >
    temp     (time, lat, lon) float32 dask.array<chunksize=(12, 15, 15), ... >
# 選特定日期
df.loc('2020-01-01')

# 依索引號選取
df.iloc[0]

# 選取欄位
df['column1']
# 選特定日期
ds.sel(time='2020-01-01')

# 依索引號選取
ds.isel(time=0)

# 選取變數
ds['variable1']
# 執行數學運算
df.mean()


# 群組後取平均
df.groupby(df['time'].dt.year).mean()


# 移動平均
rolling_mean = df.rolling(5).mean()
# 執行數學運算 df.mean()
# 群組後取平均 df.groupby(df['time'].dt.year).mean()
# 移動平均 rolling_mean = df.rolling(5).mean()
# 執行數學運算
ds.mean()
ds.mean(dim='dim1')
ds.mean(dim=('dim1', 'dim2'))


# 群組後取平均
ds.groupby(ds['time'].dt.year).mean()


# 移動平均
rolling_mean = ds.rolling(dim1=5).mean()

rolling_mean.compute()
# 執行數學運算 ds.mean() ds.mean(dim='dim1') ds.mean(dim=('dim1', 'dim2'))
# 群組後取平均 ds.groupby(ds['time'].dt.year).mean()
# 移動平均 rolling_mean = ds.rolling(dim1=5).mean()
rolling_mean.compute()
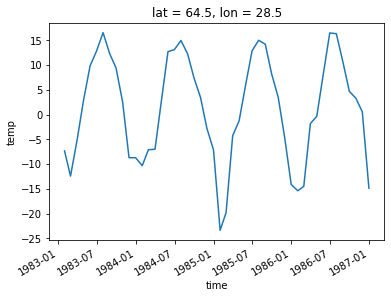
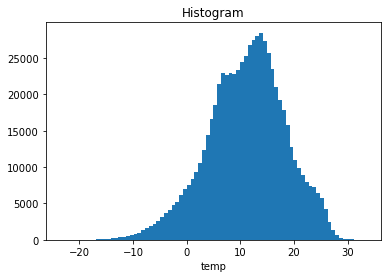
ds['variable'].plot()
範例