Python 中級預測分析
Nele Verbiest
Senior Data Scientist @PythonPredictions
# 匯入 linear_model 模組
from sklearn import linear_model

# 預測變數
variables = ["gender","age", "donations_last_year", "ratio_month_year"]

# 選擇自變數與目標
X = basetable[variables]
y = basetable[["target"]]

# 建立羅吉斯迴歸模型
logreg = linear_model.LogisticRegression()
logreg.fit(X, y)
# 匯入 linear_model 模組
from sklearn import linear_model

# 預測變數
variables = ["gender","age", "donations_last_year", "ratio_month_year"]

# 選擇自變數與目標
X = basetable[variables]
y = basetable[["target"]]

# 建立羅吉斯迴歸模型
logreg = linear_model.LogisticRegression()
logreg.fit(X, y)
# 進行預測
predictions = logreg.predict_proba(X)[:,1]
# 自 sklearn.metrics 匯入 roc_auc_score
from sklearn.metrics import roc_auc_score

# 計算 AUC
auc= roc_auc_score(y, predictions)
print(round(auc,2))
# 自 sklearn.metrics 匯入 roc_auc_score from sklearn.metrics import roc_auc_score
# 計算 AUC auc= roc_auc_score(y, predictions) print(round(auc,2))
0.56
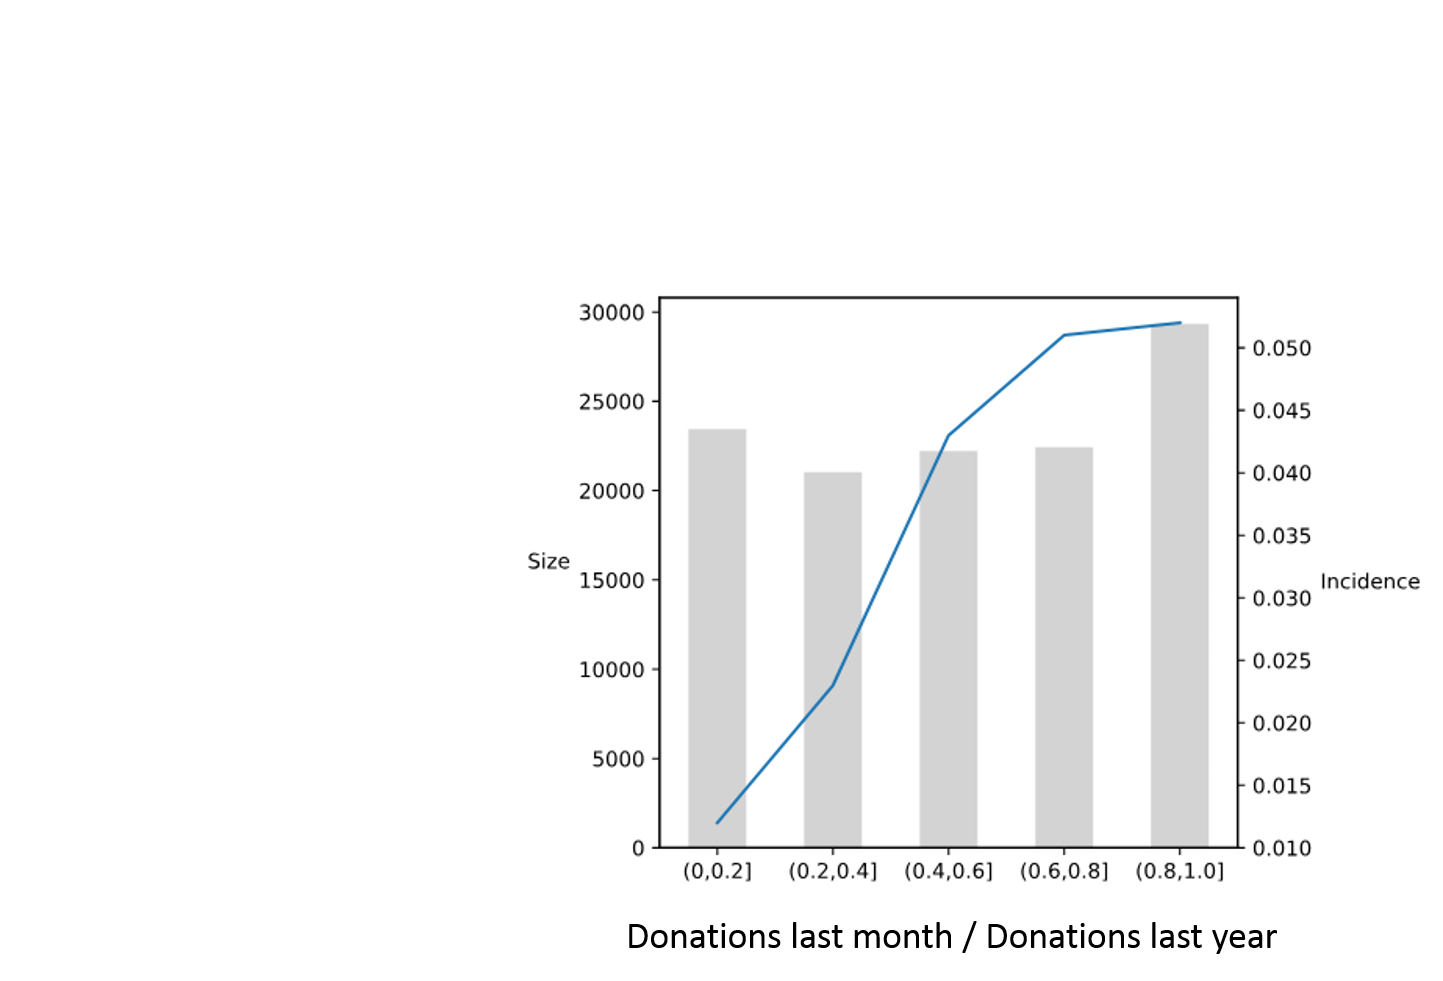
# 將變數等分為 5 個區間並加入 basetable
basetable["ratio_month_year_disc"] = pd.qcut(basetable["ratio_month_year"], 5)

# 建立預測變數洞察圖的資料表
pig_table = create_pig_table(basetable, "target","ratio_month_year_disc")

```{python}
# 繪製預測變數洞察圖
plot_pig(pig_table, "ratio_month_year_disc")
# 將變數等分為 5 個區間並加入 basetable basetable["ratio_month_year_disc"] = pd.qcut(basetable["ratio_month_year"], 5)
# 建立預測變數洞察圖的資料表 pig_table = create_pig_table(basetable, "target","ratio_month_year_disc") ```{python} # 繪製預測變數洞察圖 plot_pig(pig_table, "ratio_month_year_disc")