其他實用的視覺化函式
在 R 視覺化時間序列資料

Arnaud Amsellem
Quantitative Trader and creator of the R Trader blog
其他實用的視覺化函式
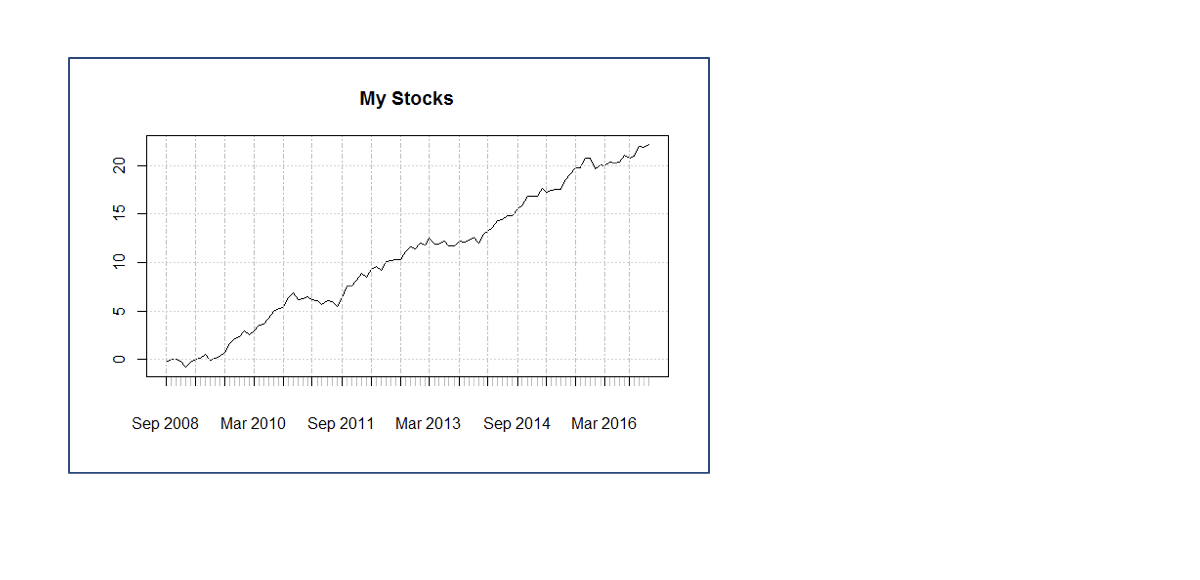
plot(my_ts, main = "My Stocks")
其他實用的視覺化函式
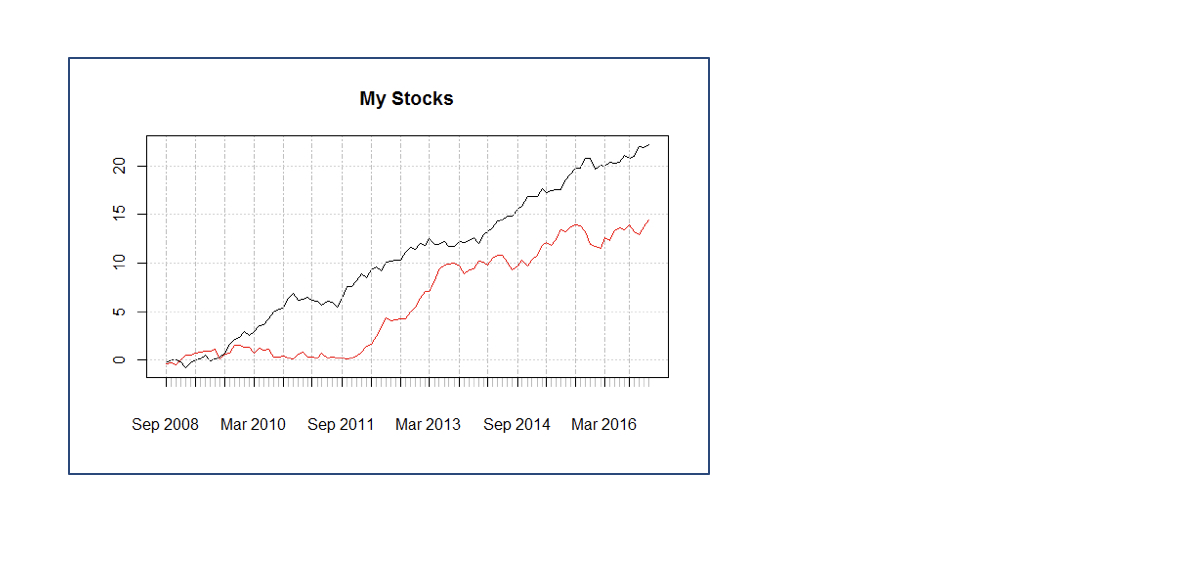
plot(my_ts, main = "My Stocks")
lines(my_ts2, col = "red")
其他實用的視覺化函式
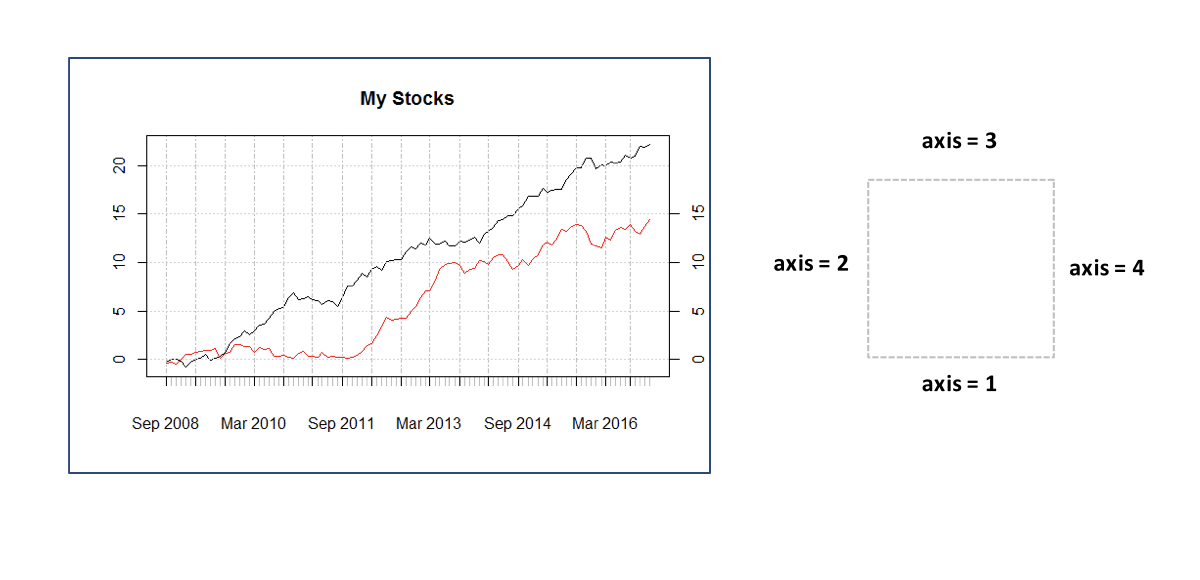
plot(my_ts, main = "My Stocks")
lines(my_ts2, col = "red")
axis(side = 4, at = pretty(my_ts2))
其他實用的視覺化函式
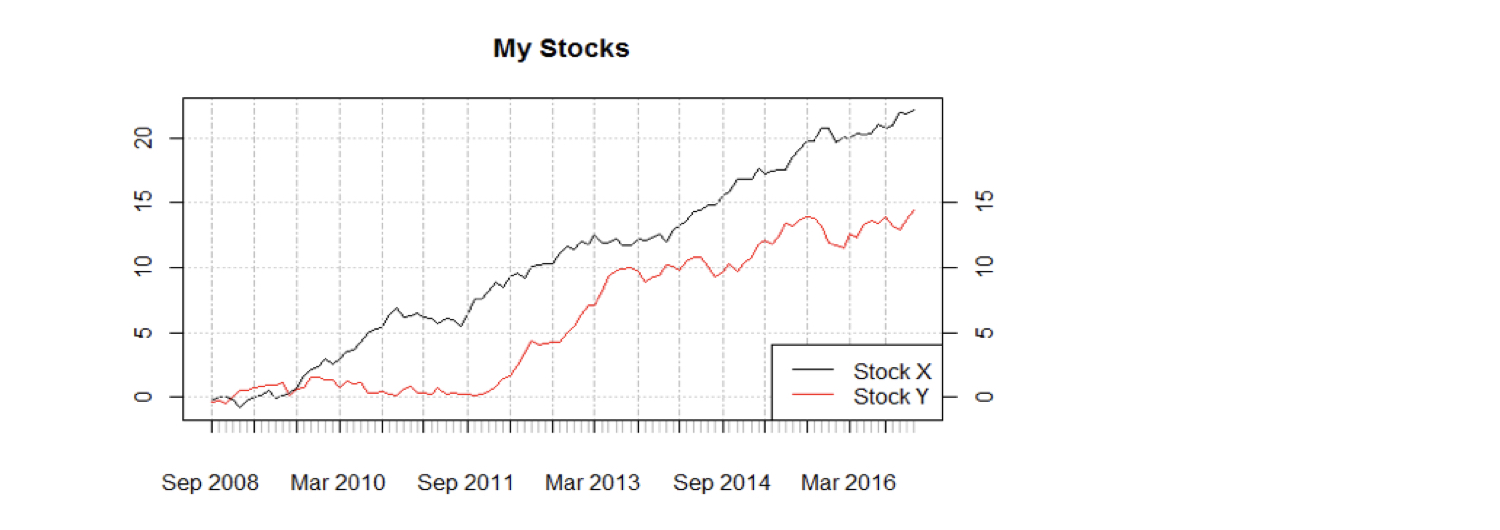
plot(my_ts, main = "My Stocks")
lines(my_ts2, col = "red")
axis(side = 4, at = pretty(my_ts2))
legend(x = "bottomright", legend = c("Stock X", "Stock Y"),
       col = c("black", "red"), lty = c(1, 1))
abline() 範例
abline(v = as.Date("2016-04-14"))
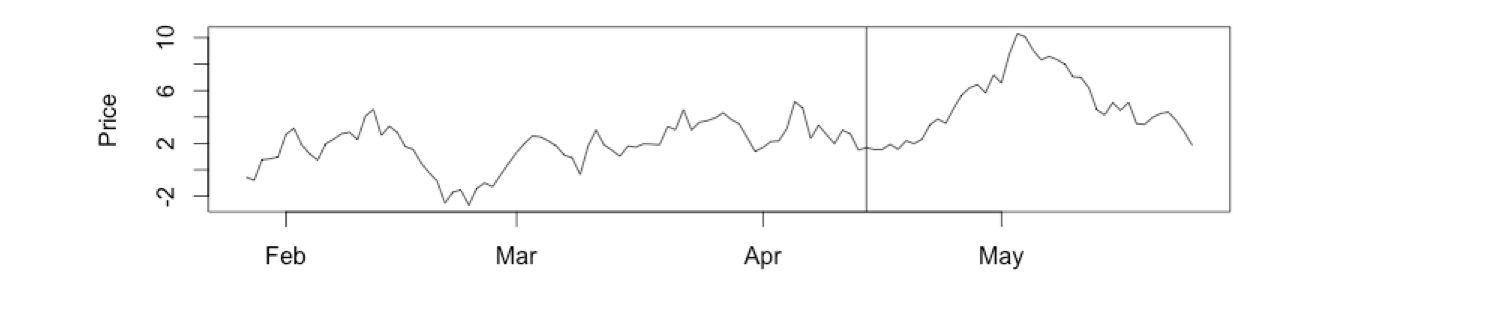
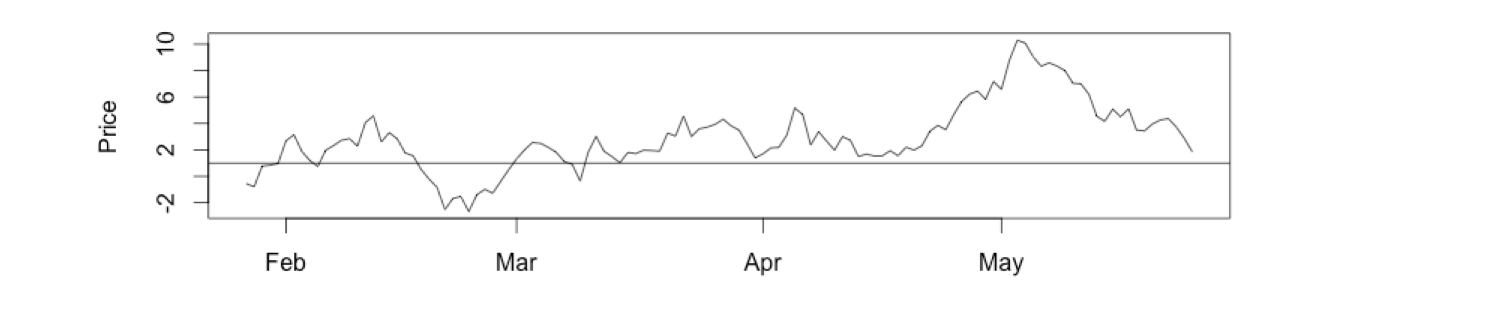
abline() 範例
abline(v = as.Date("2016-04-14"))
abline(h = 1)
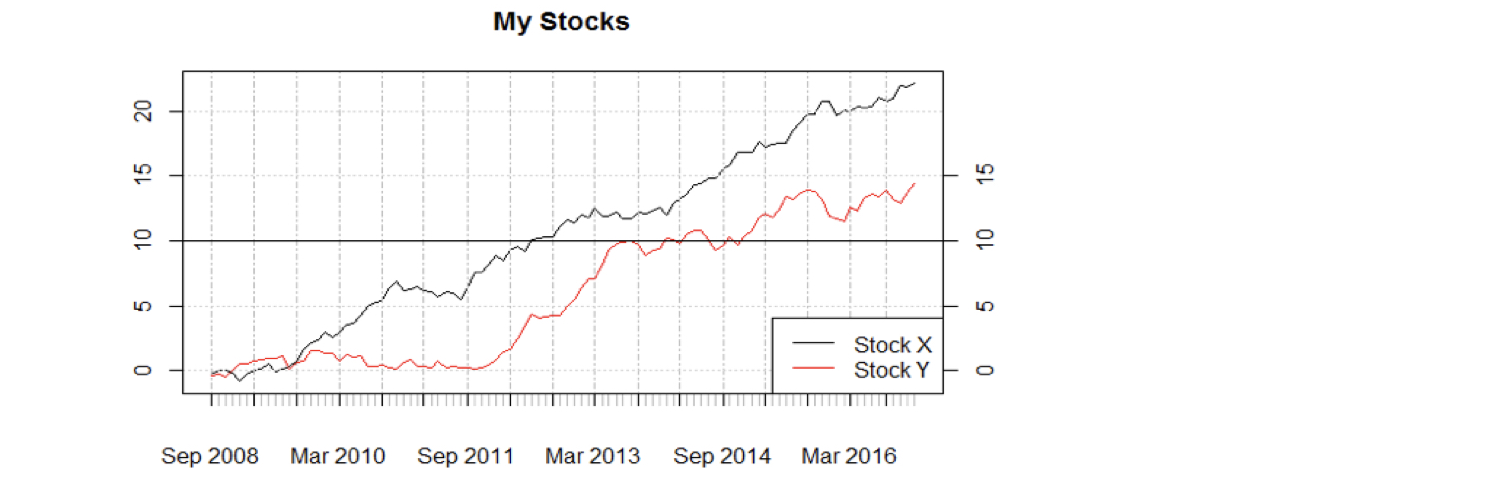
其他實用的視覺化函式
plot(my_ts, main = "My Stocks")
lines(my_ts2, col = "red")
axis(side = 4, at = pretty(my_ts2))
legend(x = "bottomright", legend = c("Stock X", "Stock Y"),
       col = c("black", "red"), lty = c(1, 1))
abline(h = 10)
其他實用的視覺化函式
library(PerformanceAnalytics)
period <- c("2014-01/2015-06")
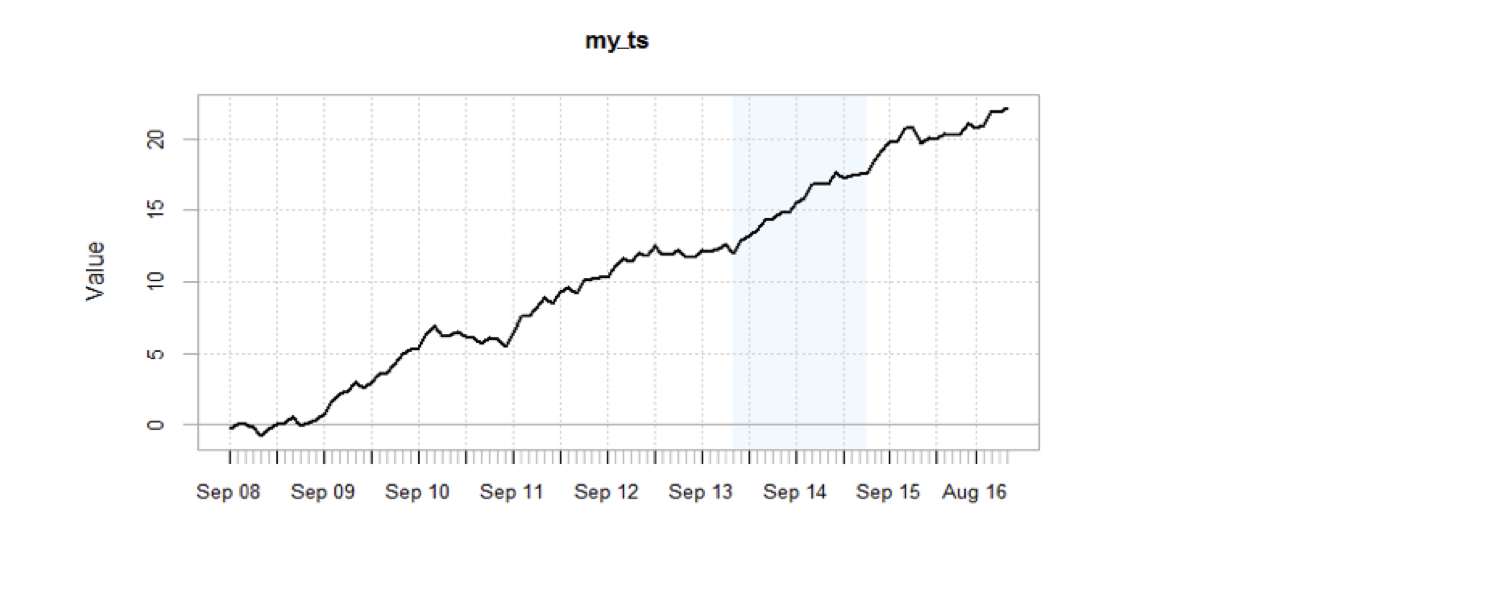
chart.TimeSeries(my_ts, period.areas = period, main = "my_ts")