新股票
在 R 視覺化時間序列資料

Arnaud Amsellem
Quantitative Trader and creator of the R Trader blog
目前結論
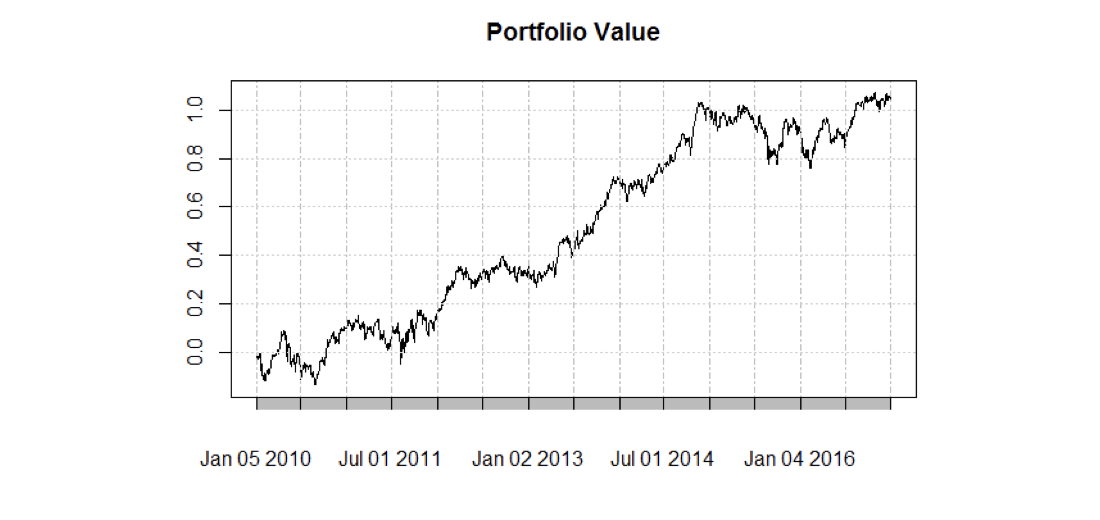
- 7 年間上漲 100%
目前結論
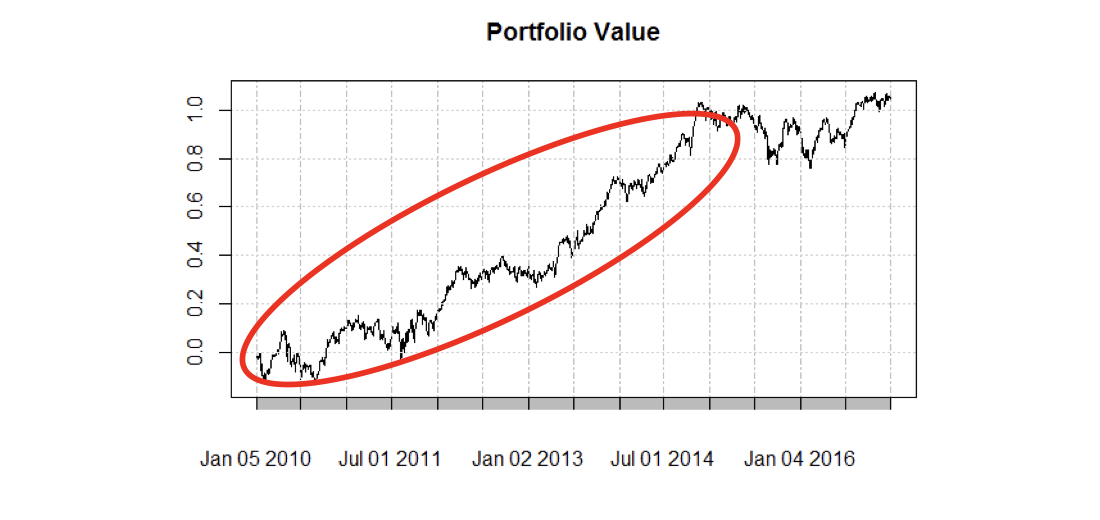
- 7 年間上漲 100%
- 2010–2014 表現亮眼
目前結論
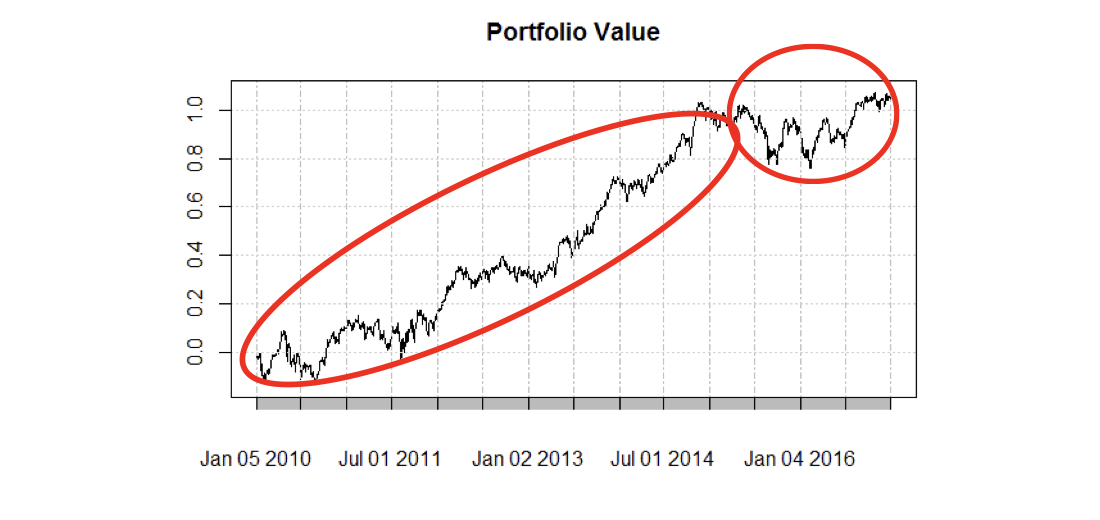
- 7 年間上漲 100%
- 2010–2014 表現亮眼
- 2014 年底後無成長
在 R 視覺化時間序列資料
Arnaud Amsellem
Quantitative Trader and creator of the R Trader blog

