多變量資料繪圖
R 的多變量機率分配

Surajit Ray
Professor, University of Glasgow
多變量的基本 R 繪圖
pairs(iris_raw[, 1:4])
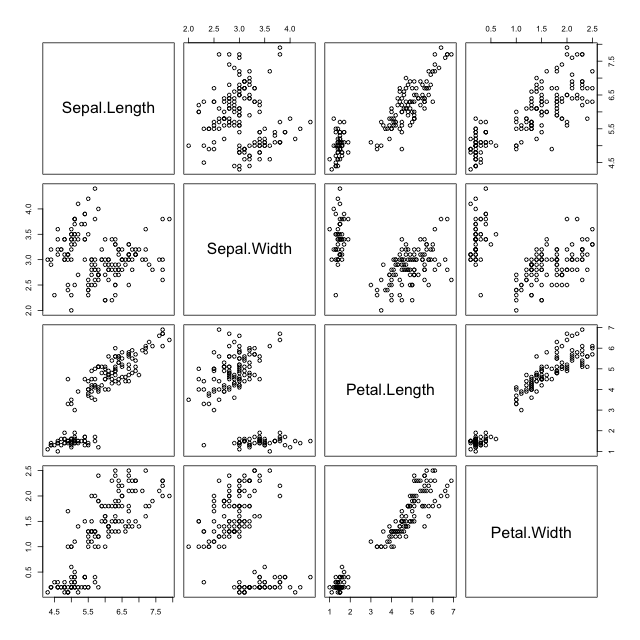
- 變數多時,圖不易解讀
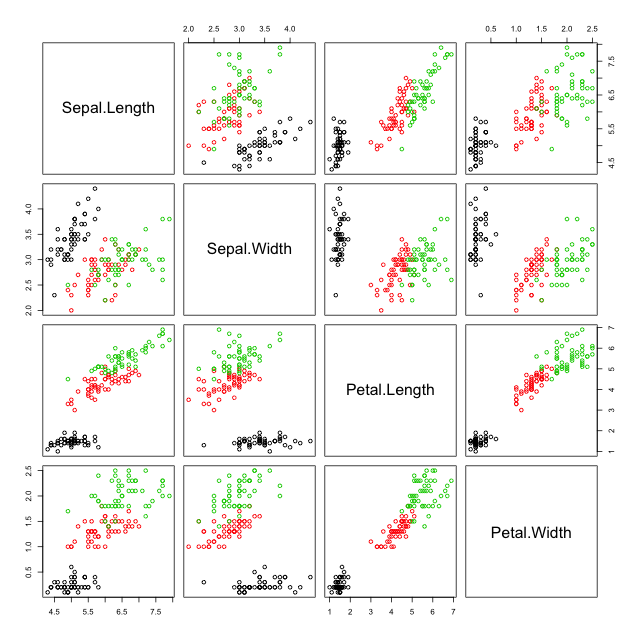
以顏色區分類別的 pairs 圖
pairs(iris_raw[, 1:4], col = iris_raw$Species)
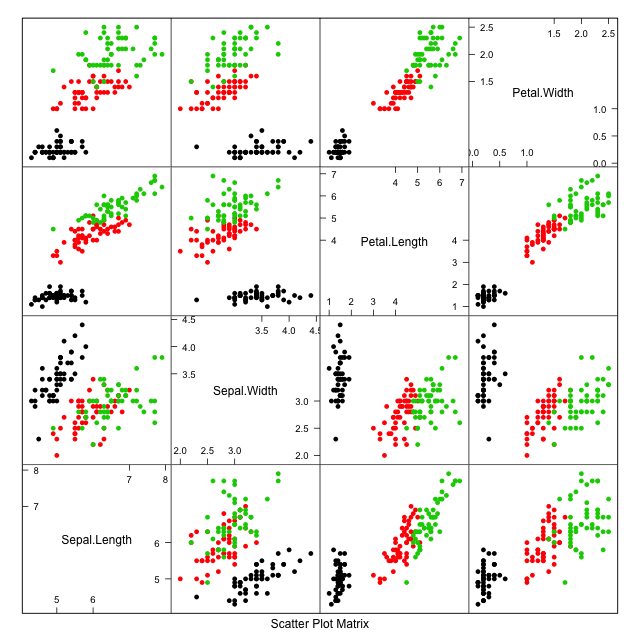
Lattice
library(lattice)
splom(~iris_raw[, 1:4], col = iris_raw$Species, pch = 16)
使用 ggplot
library(ggplot2)
library(GGally)
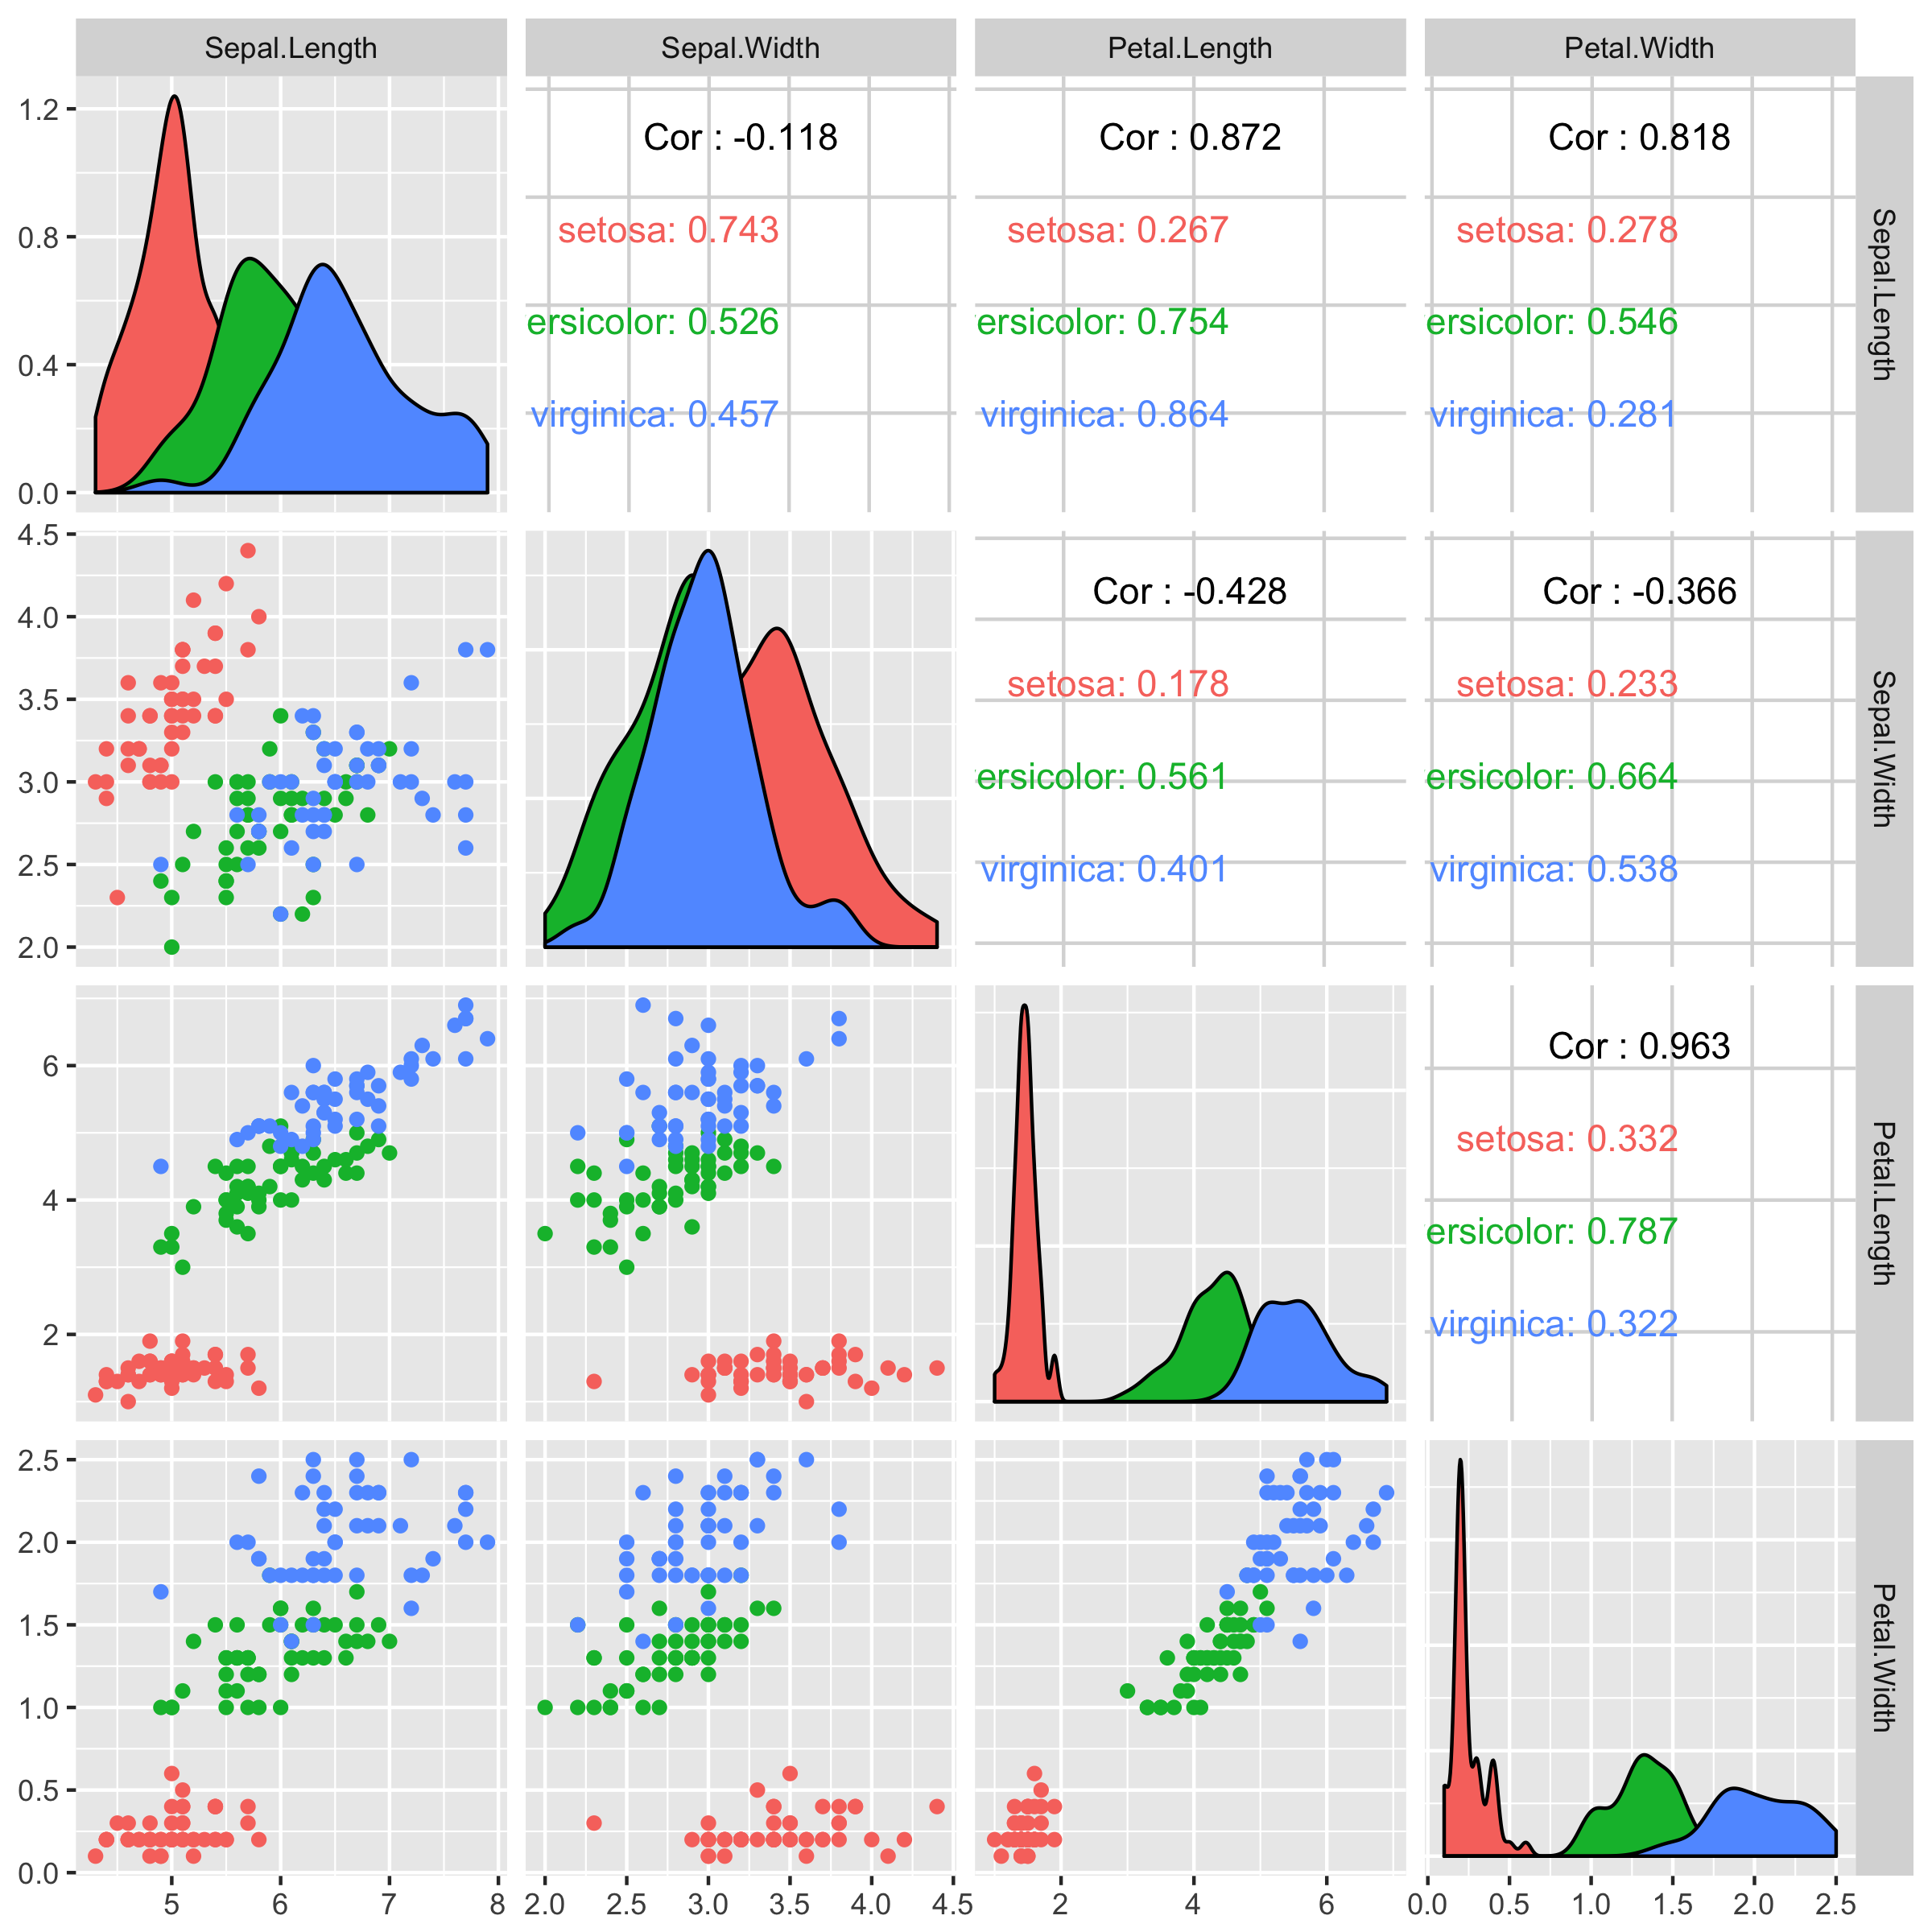
ggpairs(data = iris_raw, columns = 1:4, mapping = aes(color = Species))
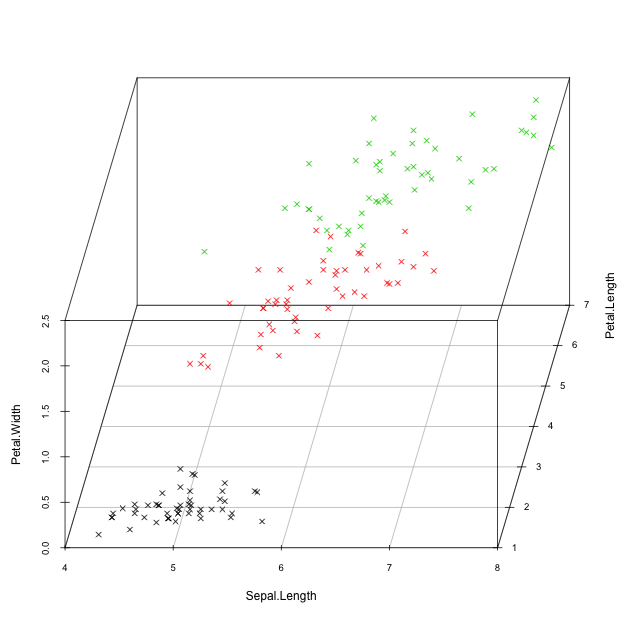
3D 繪圖
library(scatterplot3d)
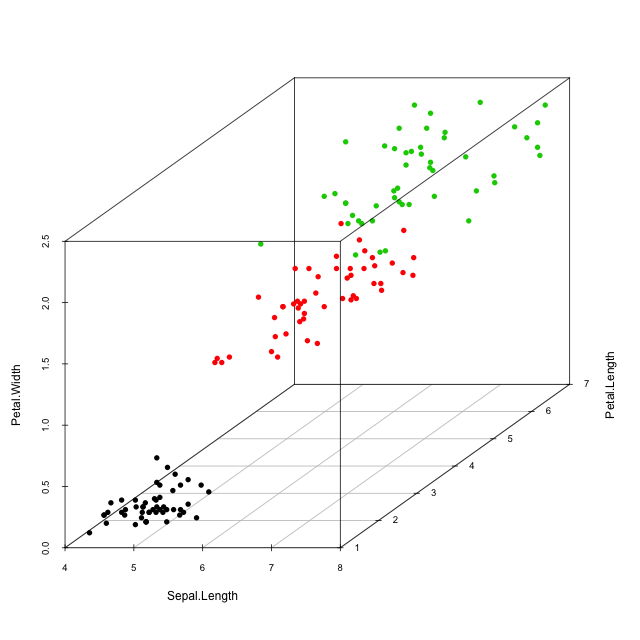
scatterplot3d(iris_raw[, c(1, 3, 4)], color = as.numeric(iris_raw$Species))
3D 繪圖
scatterplot3d(iris_raw[, c(1, 3, 4)], color = as.numeric(iris_raw$Species),pch = 4, angle = 80)