平均向量與變異數—共變異數矩陣

R 的多變量機率分配

Surajit Ray

Professor, University of Glasgow

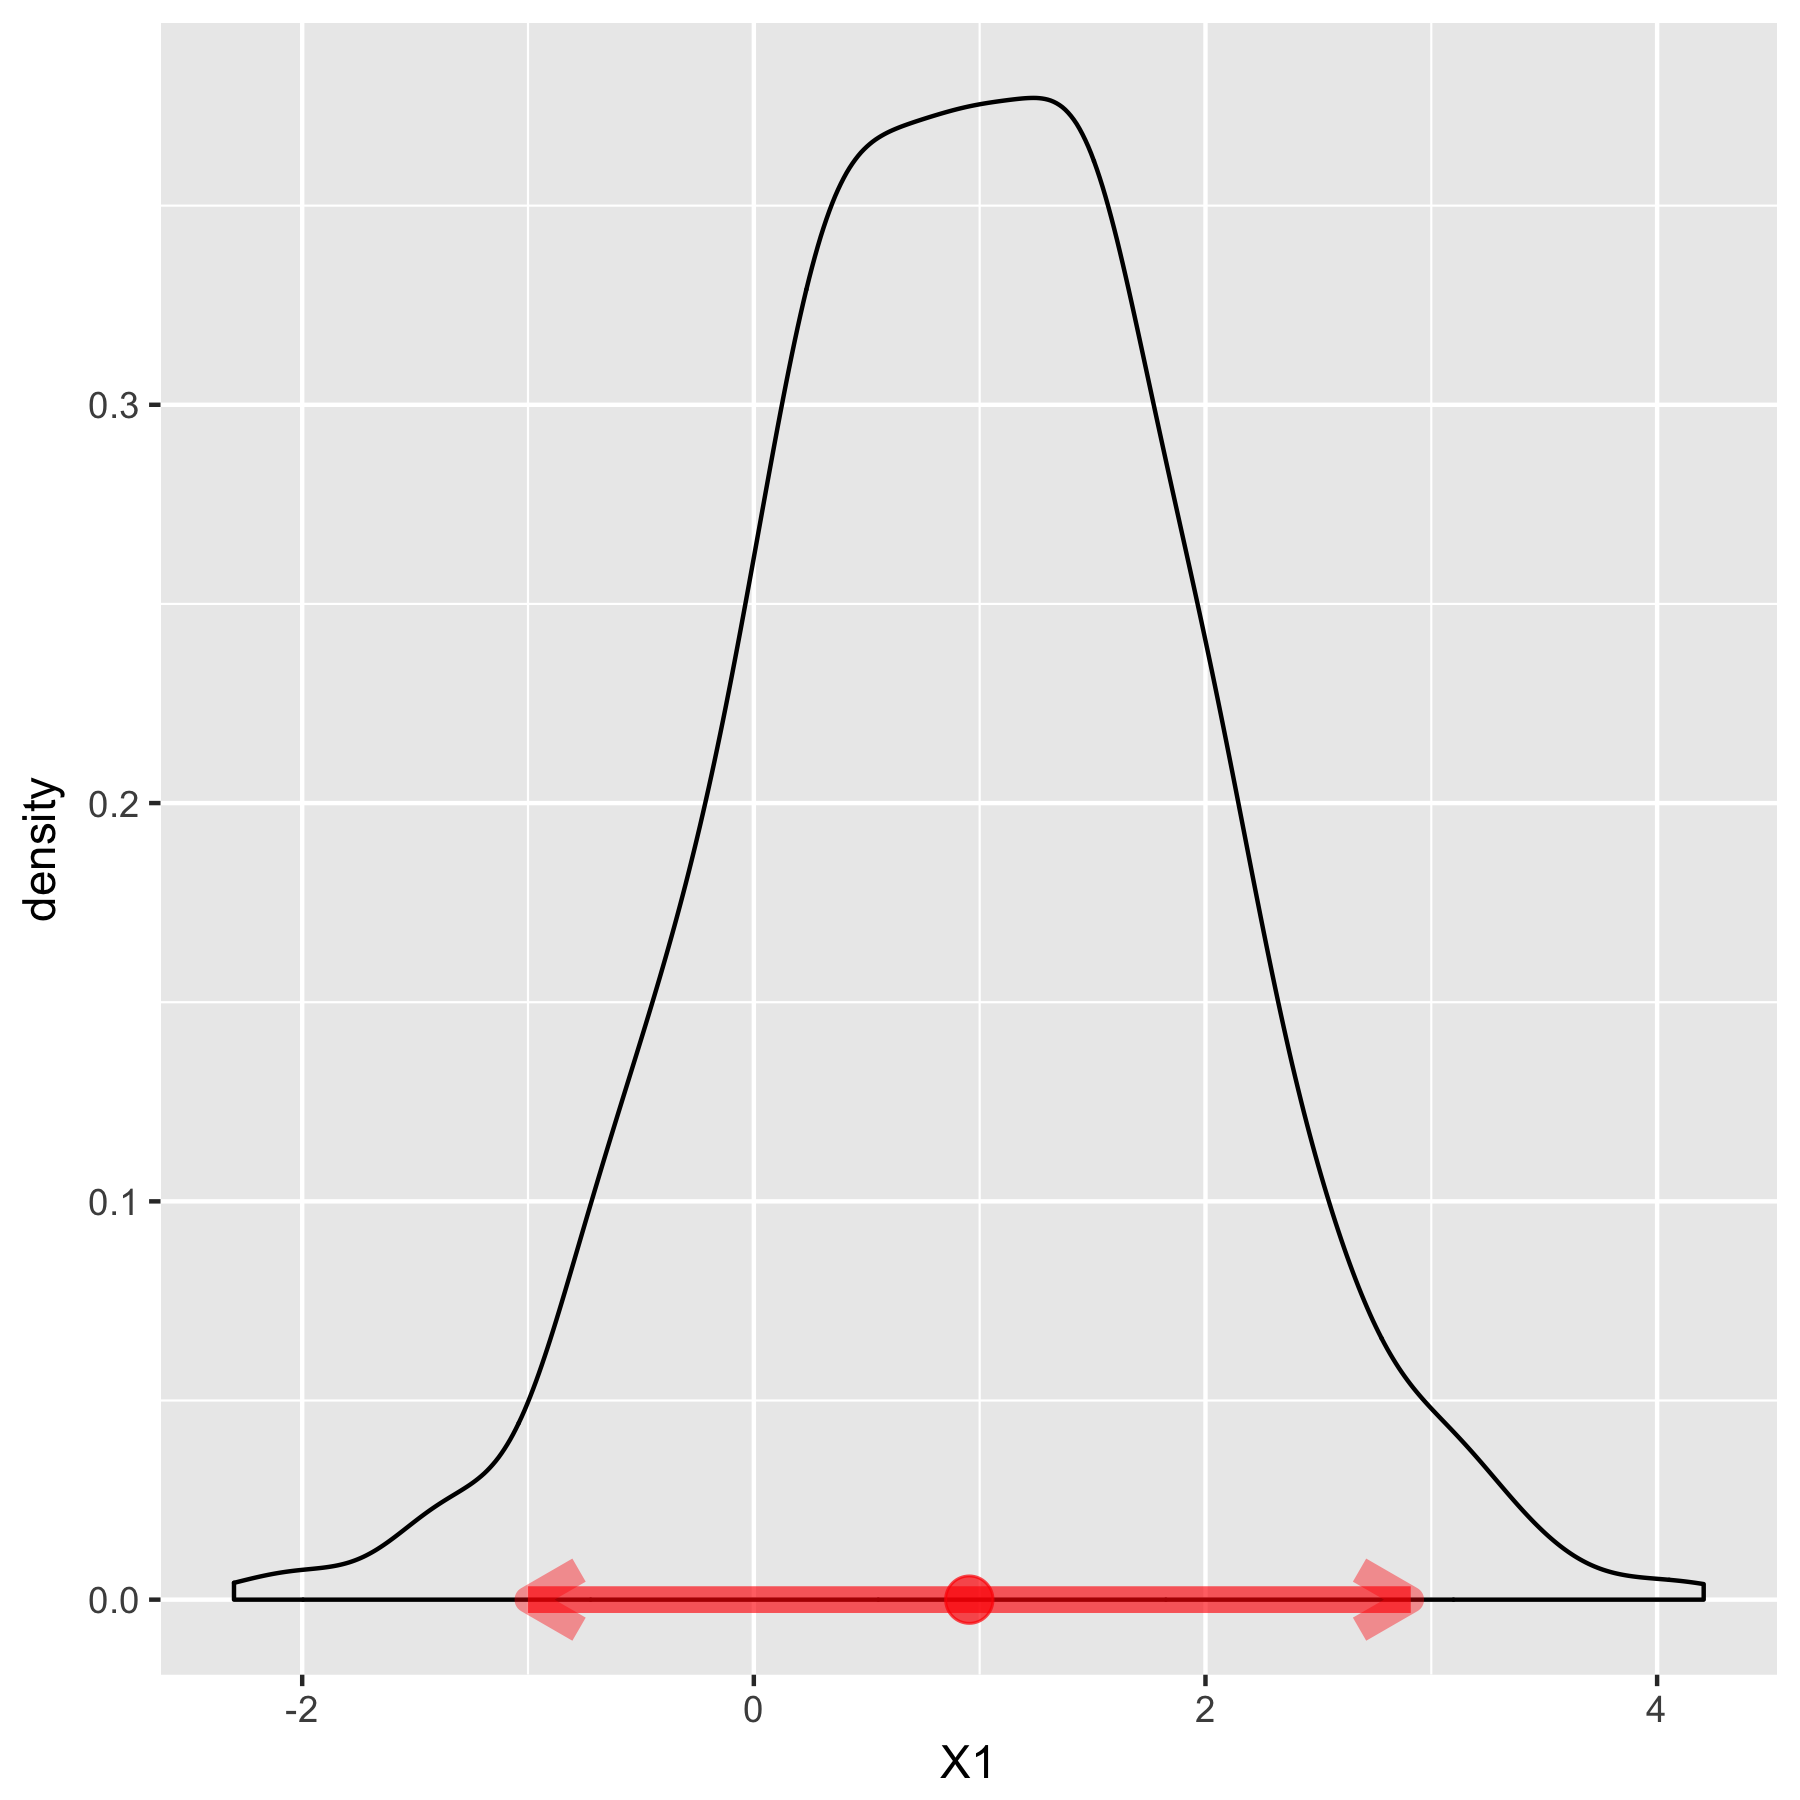
平均表示分配的位置
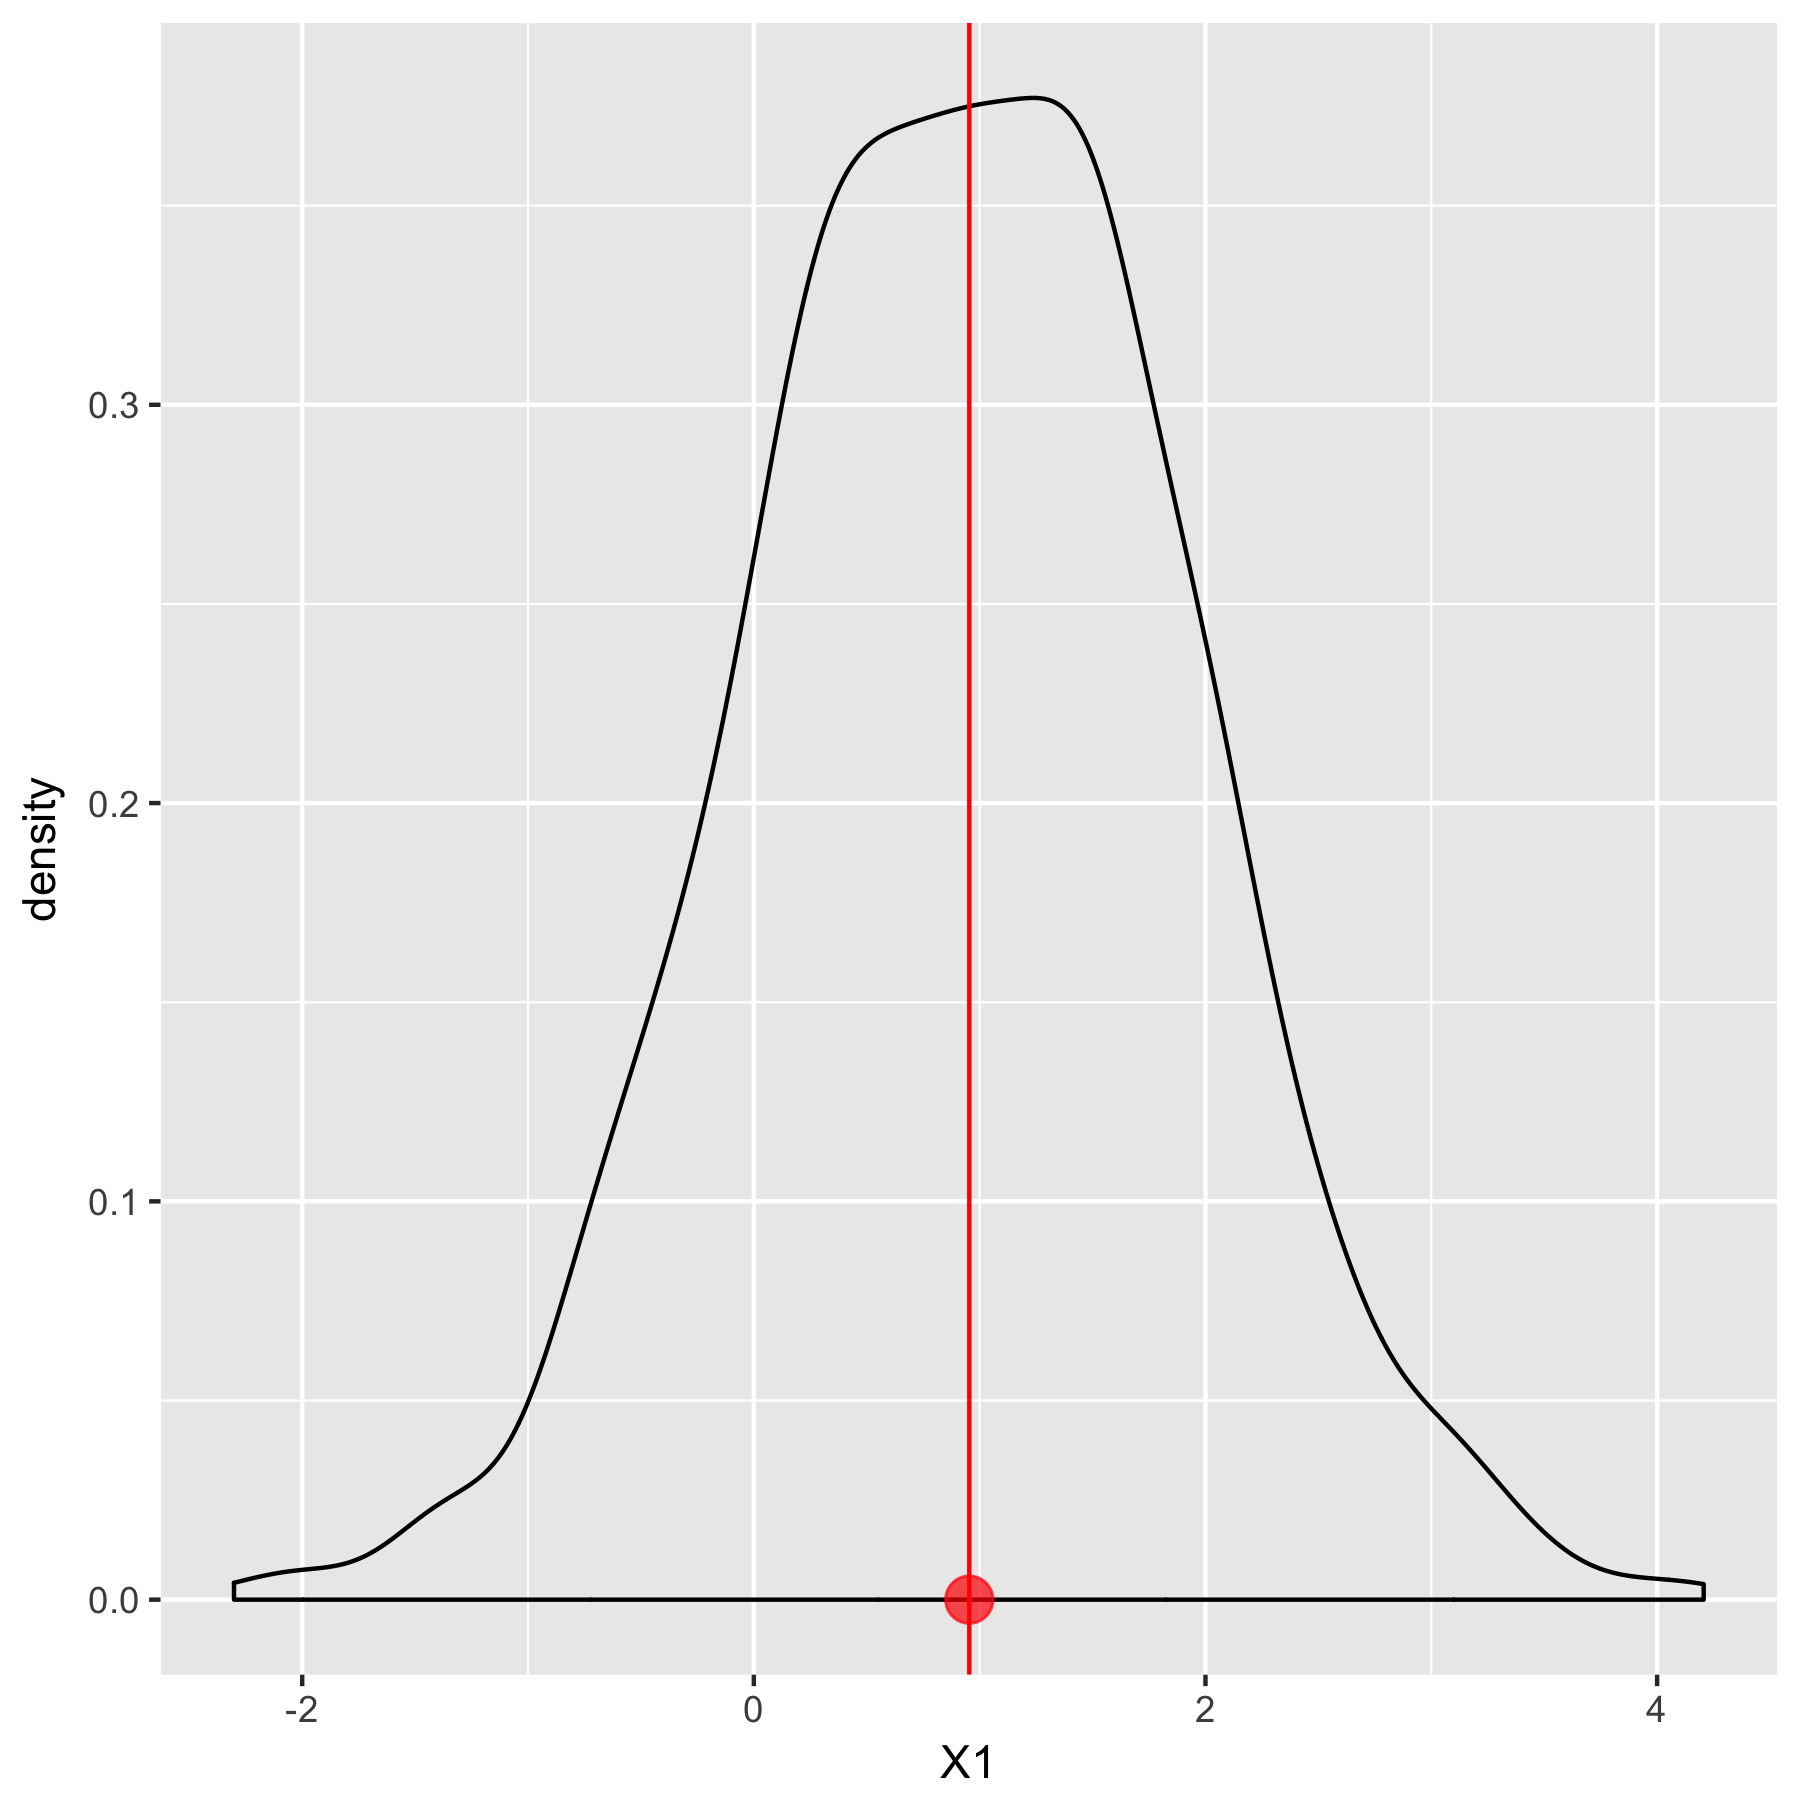
                                               平均 $0.95$
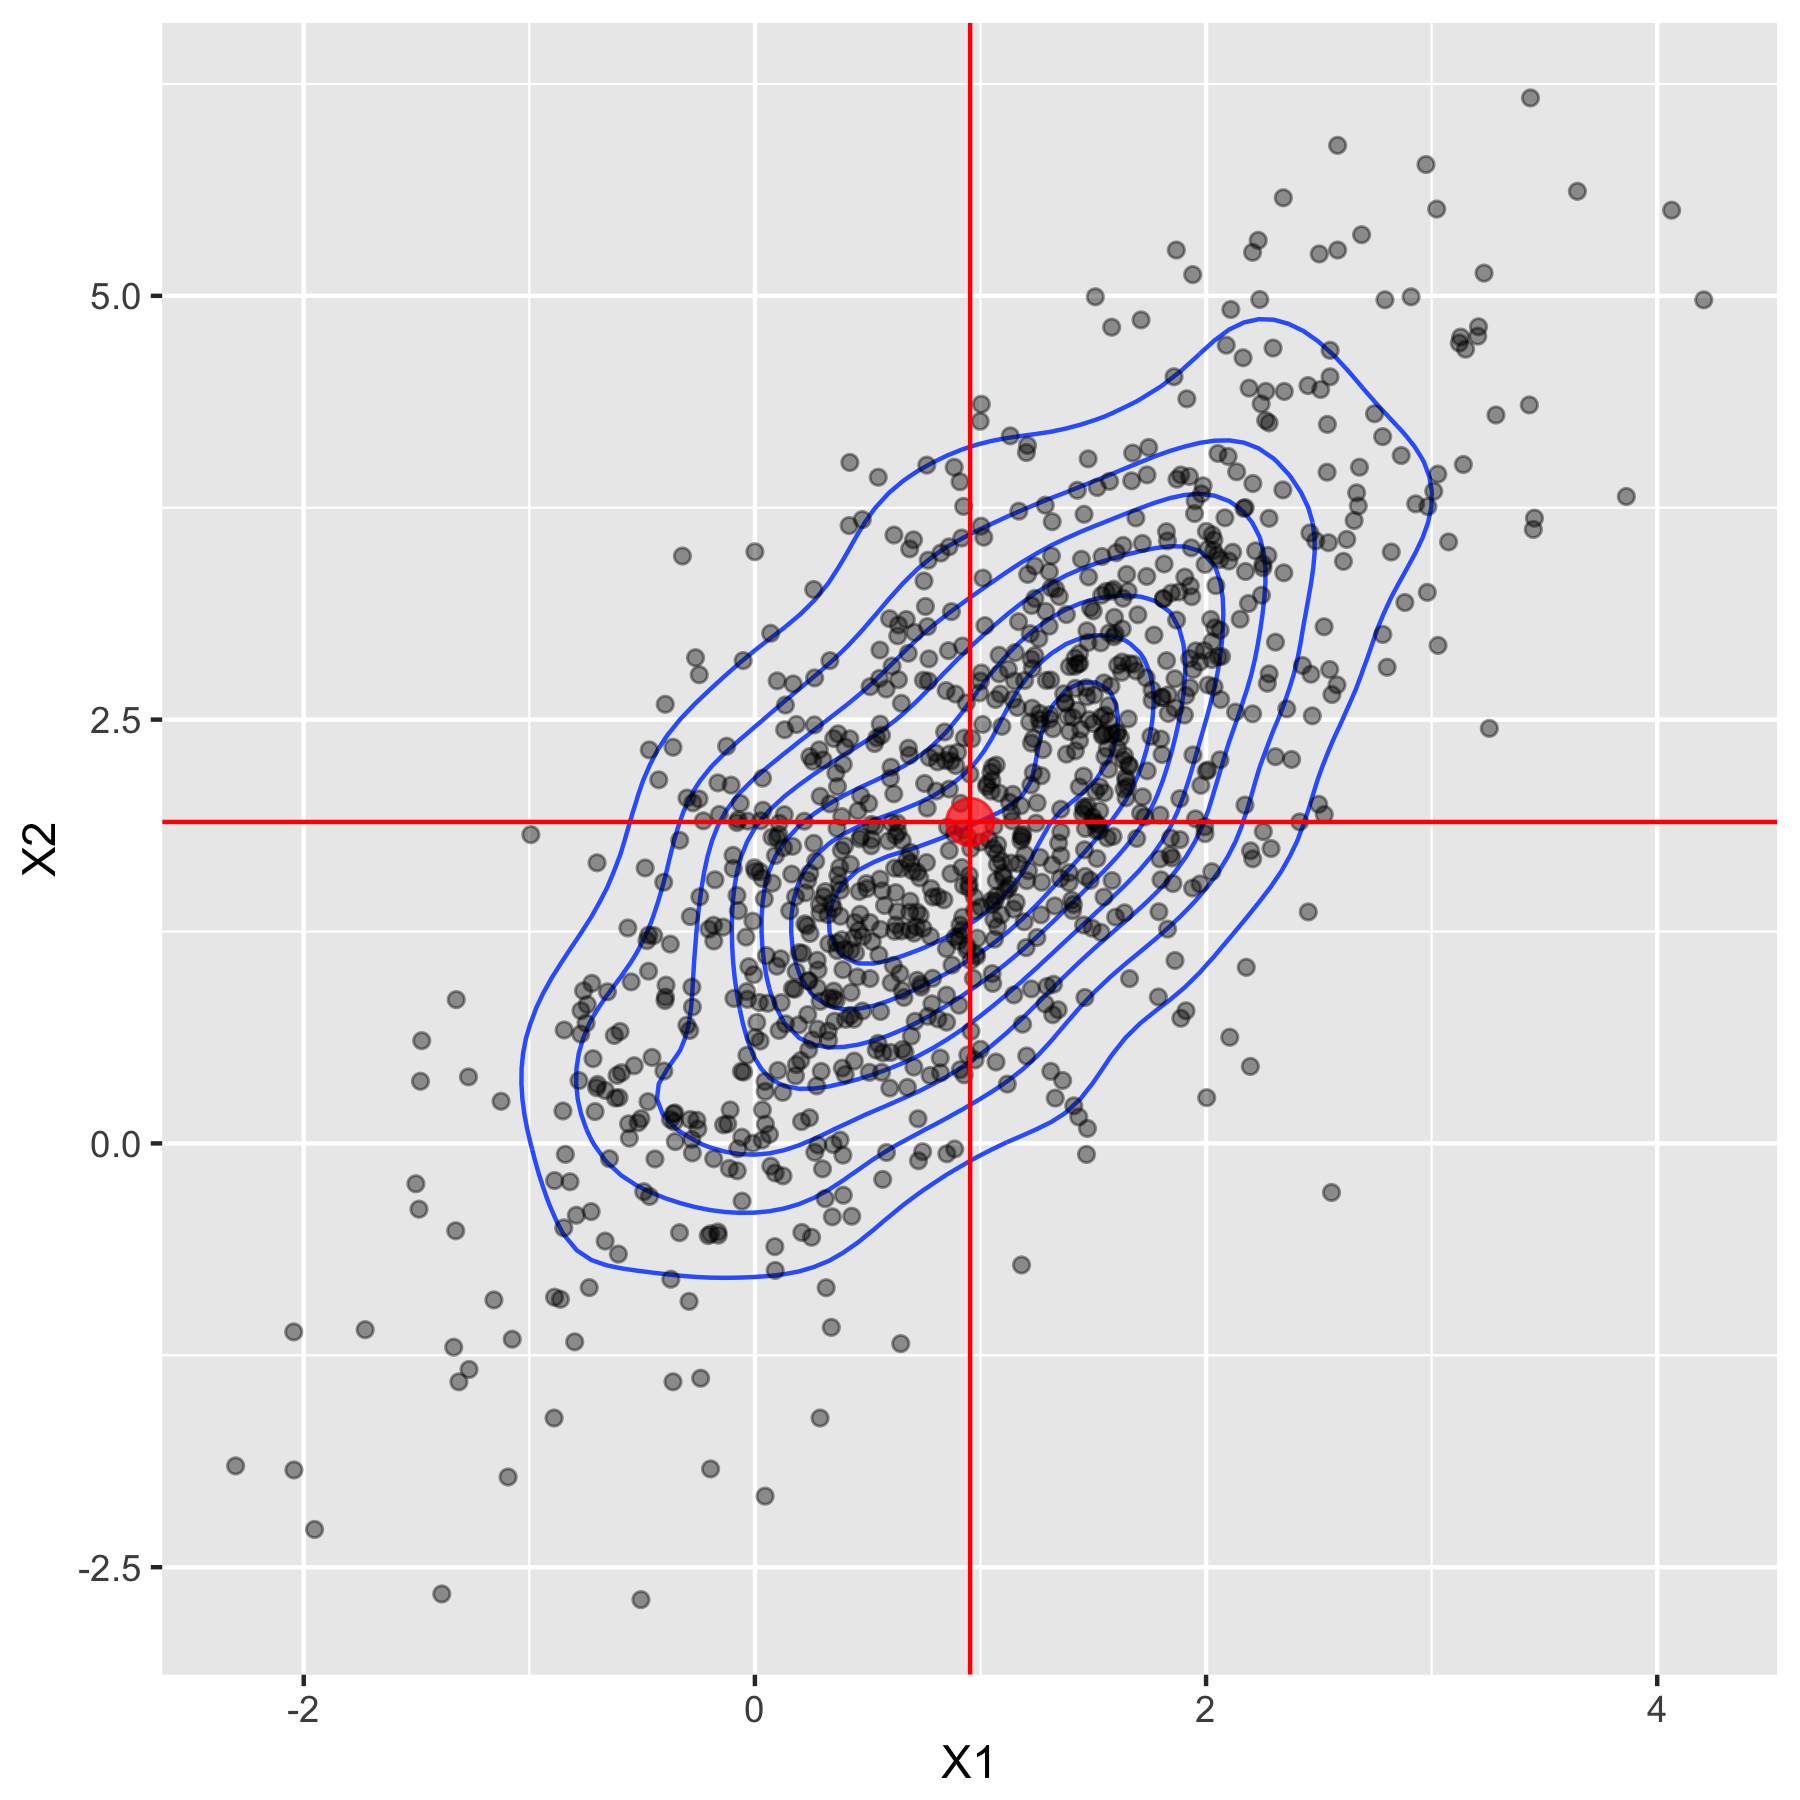
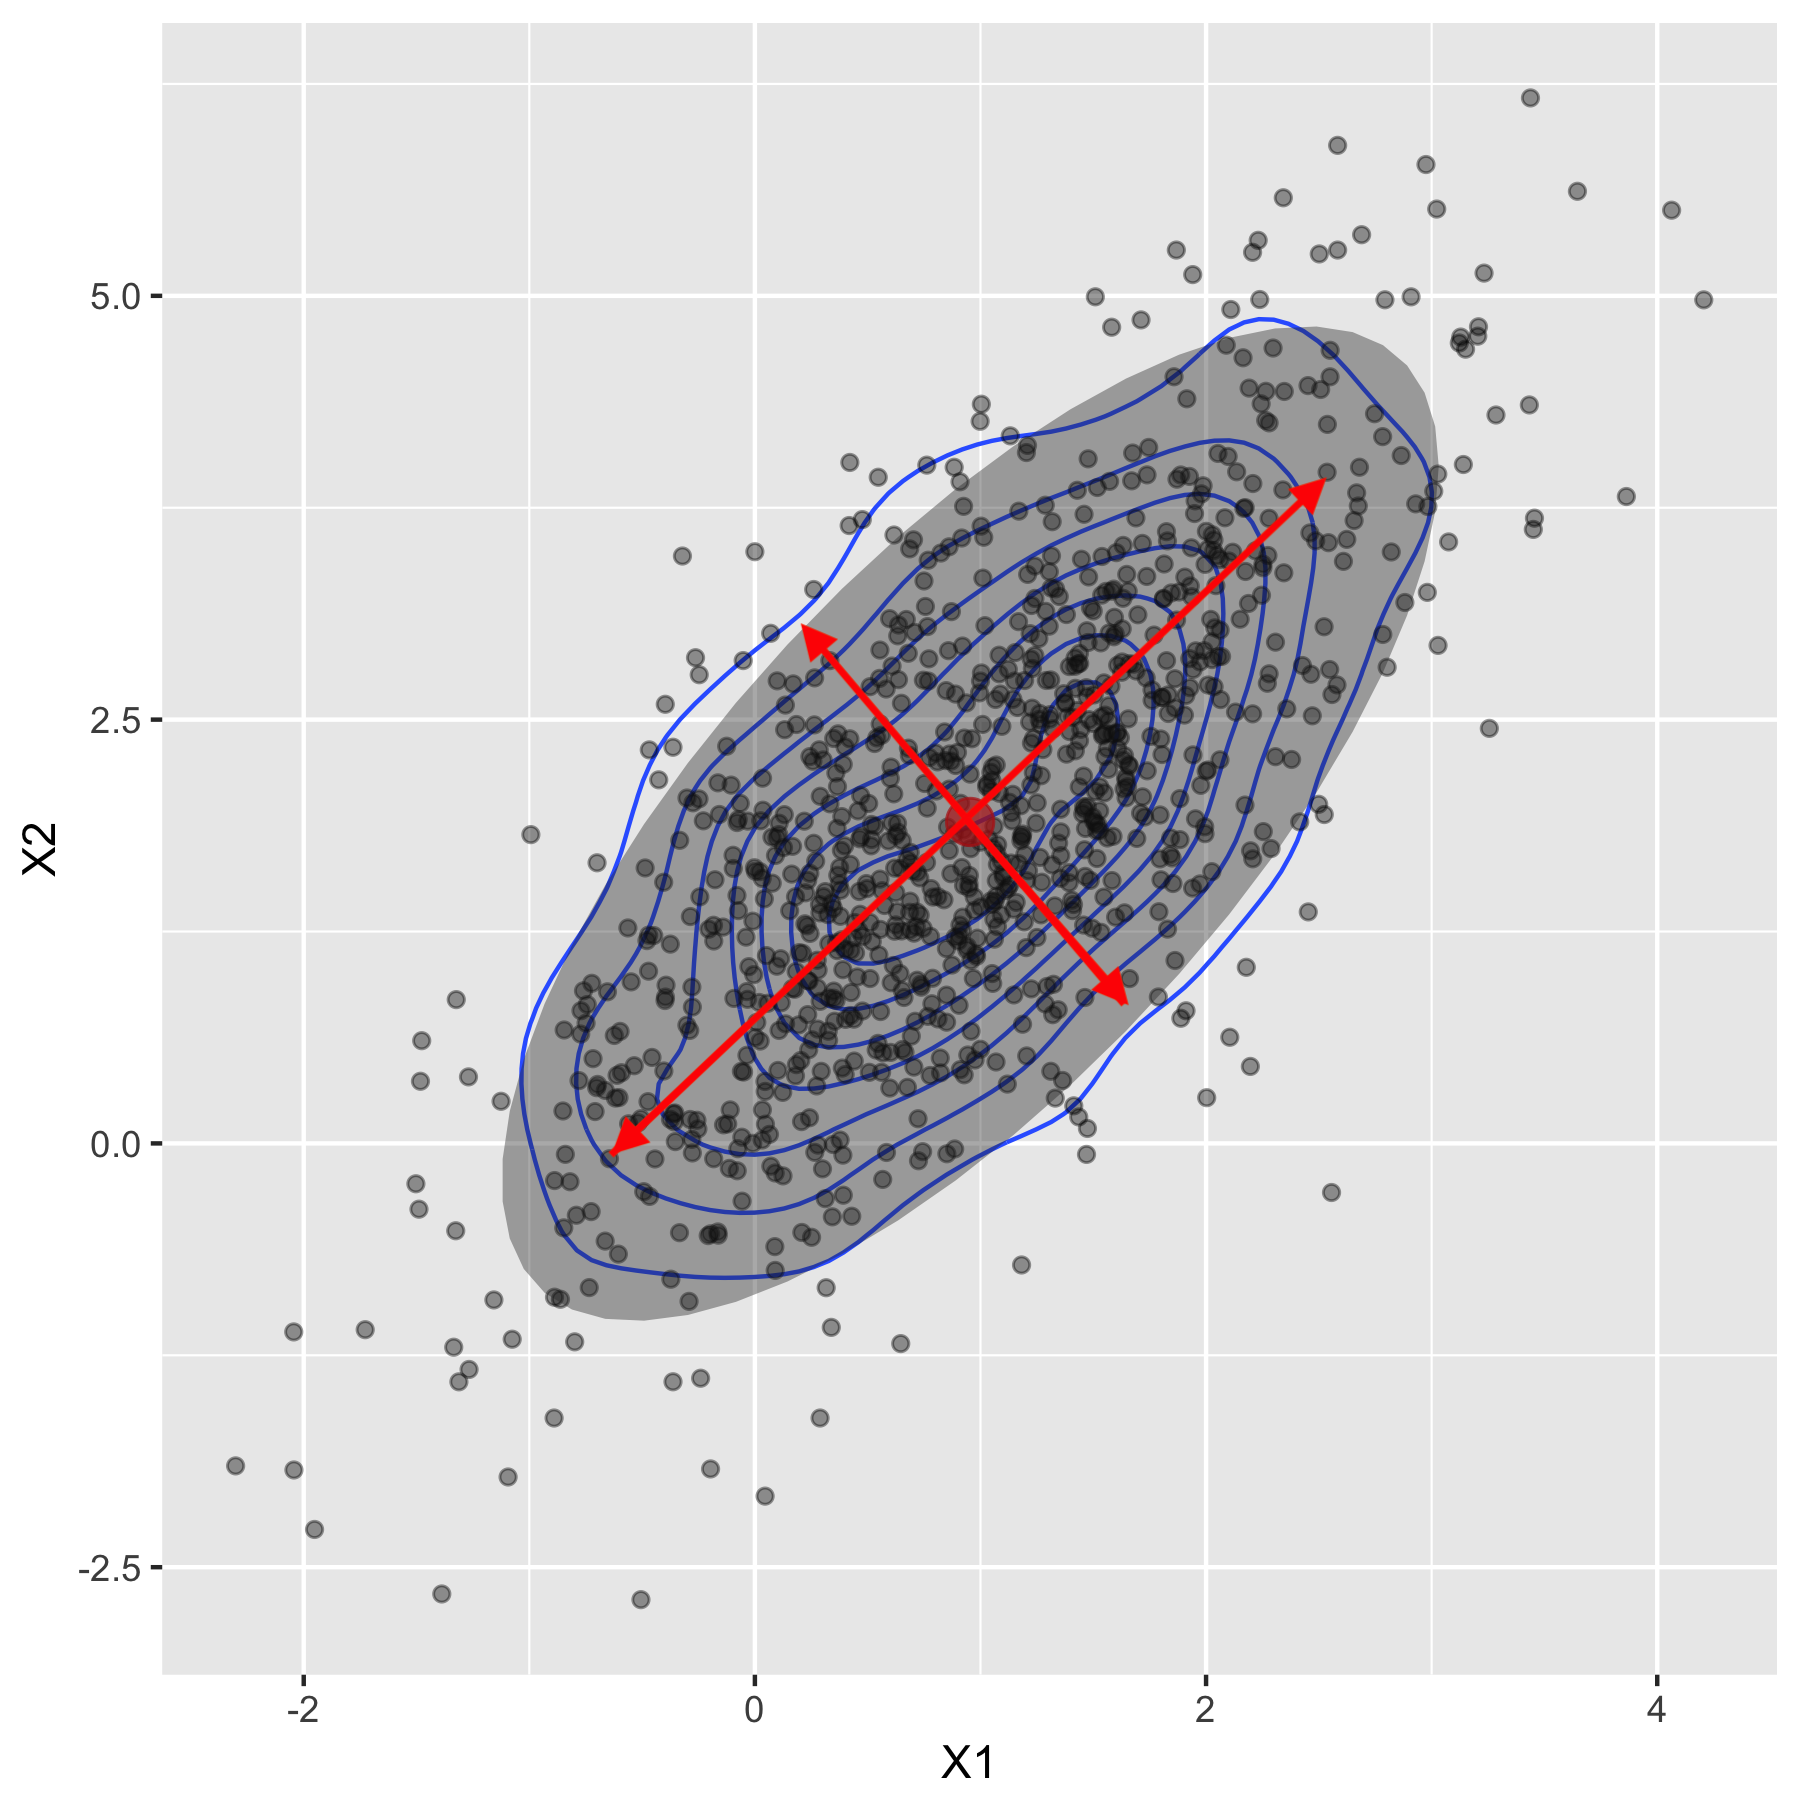
                                  平均向量 (0.95 1.89)

R 的多變量機率分配

變異數—共變異數矩陣代表離散程度

                                            變異數 $1.02$

變異數—共變異數 ${\begin{pmatrix} 1.02 & 0.97 \\ 0.97 & 2 \end{pmatrix}}$

R 的多變量機率分配

計算平均

colMeans(iris_raw[, 1:4])
Sepal.Length  Sepal.Width Petal.Length  Petal.Width 
        5.84         3.05         3.76         1.20

依子群計算平均的函式

  • by()
  • aggregate()
R 的多變量機率分配

用 by 計算群組平均

by(data = iris[,1:4], INDICES = iris$Species, FUN = colMeans)
iris_raw$Species: setosa
Sepal.Length  Sepal.Width Petal.Length  Petal.Width 
       5.006        3.418        1.464        0.244 
 ----------------------------------------------------
iris_raw$Species: versicolor
Sepal.Length  Sepal.Width Petal.Length  Petal.Width 
       5.936        2.770        4.260        1.326 
 ----------------------------------------------------
iris_raw$Species: virginica
Sepal.Length  Sepal.Width Petal.Length  Petal.Width 
       6.588        2.974        5.552        2.026
R 的多變量機率分配

用 aggregate 計算群組平均

aggregate(. ~ Species, iris_raw, mean)
     Species Sepal.Length Sepal.Width Petal.Length Petal.Width
1     setosa         5.01        3.42         1.46       0.244
2 versicolor         5.94        2.77         4.26       1.326
3  virginica         6.59        2.97         5.55       2.026
R 的多變量機率分配

計算變異數—共變異數與相關矩陣

var(iris_raw[, 1:4])
             Sepal.Length Sepal.Width Petal.Length Petal.Width
Sepal.Length       0.6857     -0.0393        1.274       0.517
Sepal.Width       -0.0393      0.1880       -0.322      -0.118
Petal.Length       1.2737     -0.3217        3.113       1.296
Petal.Width        0.5169     -0.1180        1.296       0.582

相關係數

cor(iris_raw[, 1:4])
             Sepal.Length Sepal.Width Petal.Length Petal.Width
Sepal.Length        1.000      -0.109        0.872       0.818
Sepal.Width        -0.109       1.000       -0.421      -0.357
Petal.Length        0.872      -0.421        1.000       0.963
Petal.Width         0.818      -0.357        0.963       1.000
R 的多變量機率分配

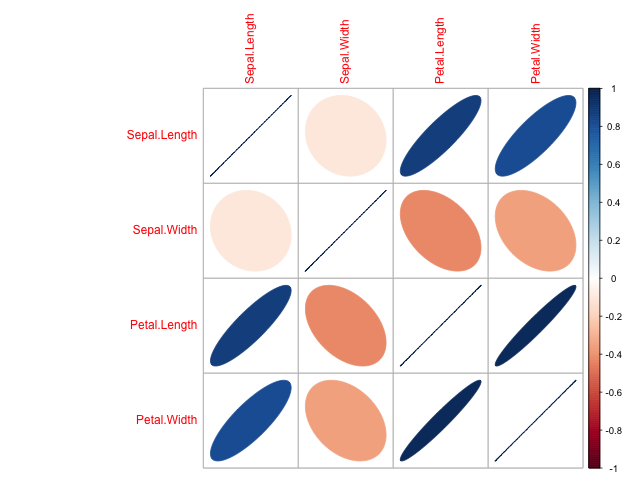
相關矩陣的視覺化

使用 corrplot 視覺化相關矩陣

corrplot(cor(iris_raw[, 1:4]), method = "ellipse")
R 的多變量機率分配

解讀平均

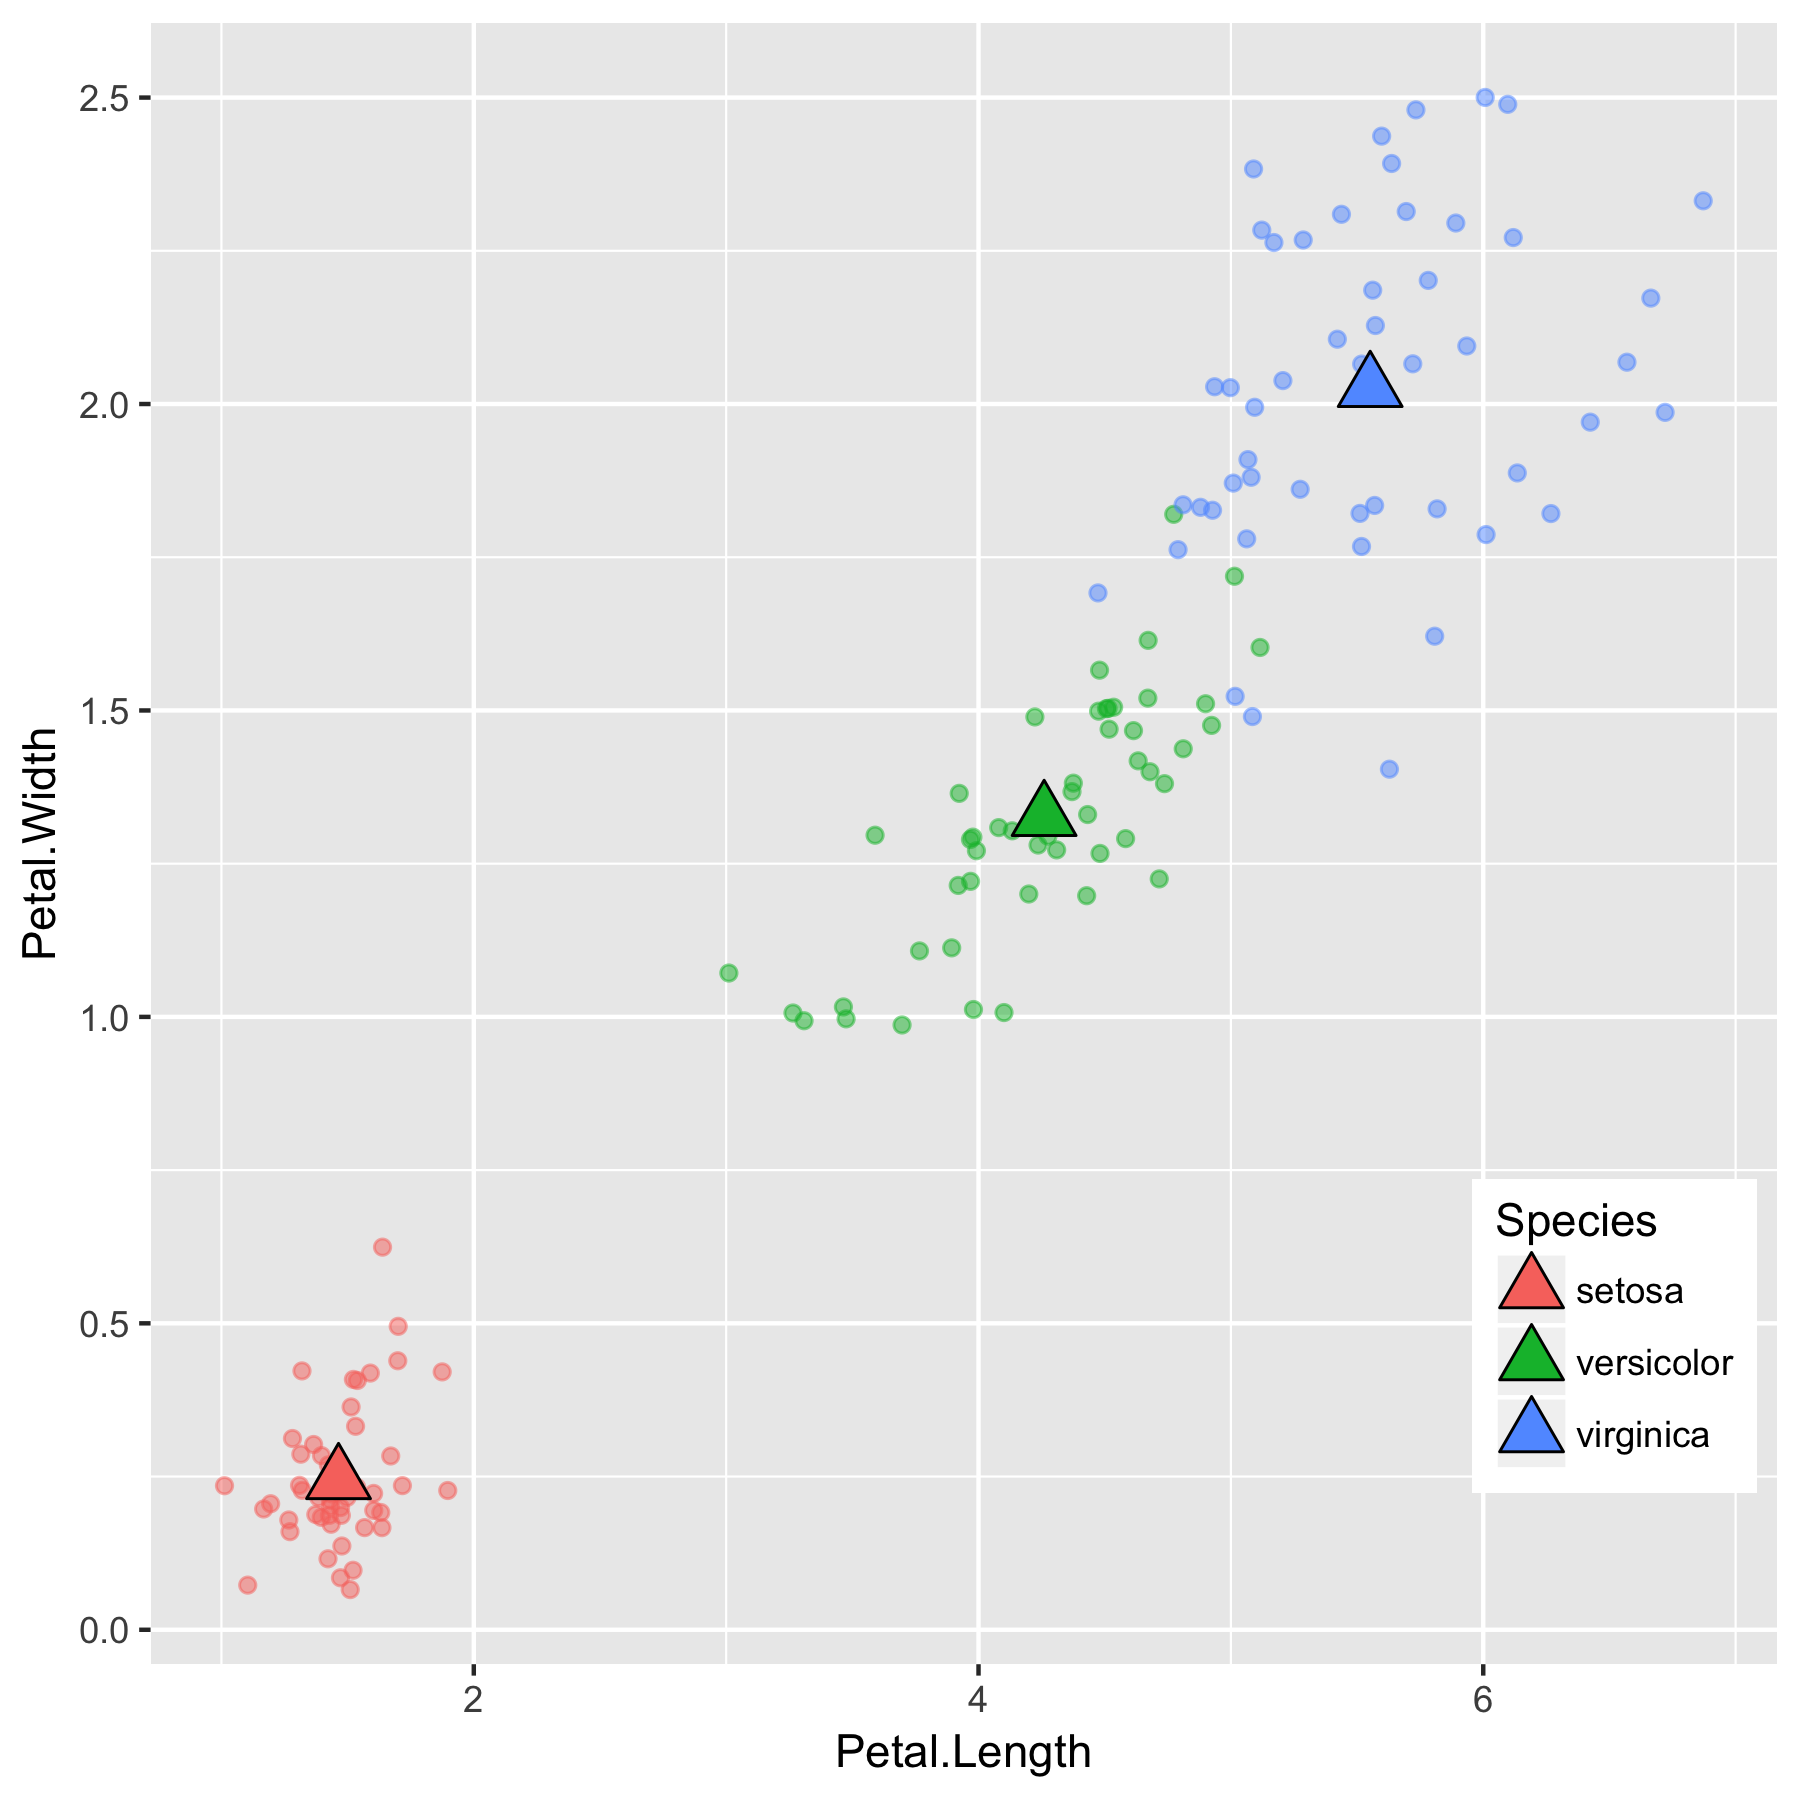
平均

Species Petal.Length Petal.Width
setosa 1.46 0.244
versicolor 4.26 1.326
virginica 5.55 2.026

mean

R 的多變量機率分配

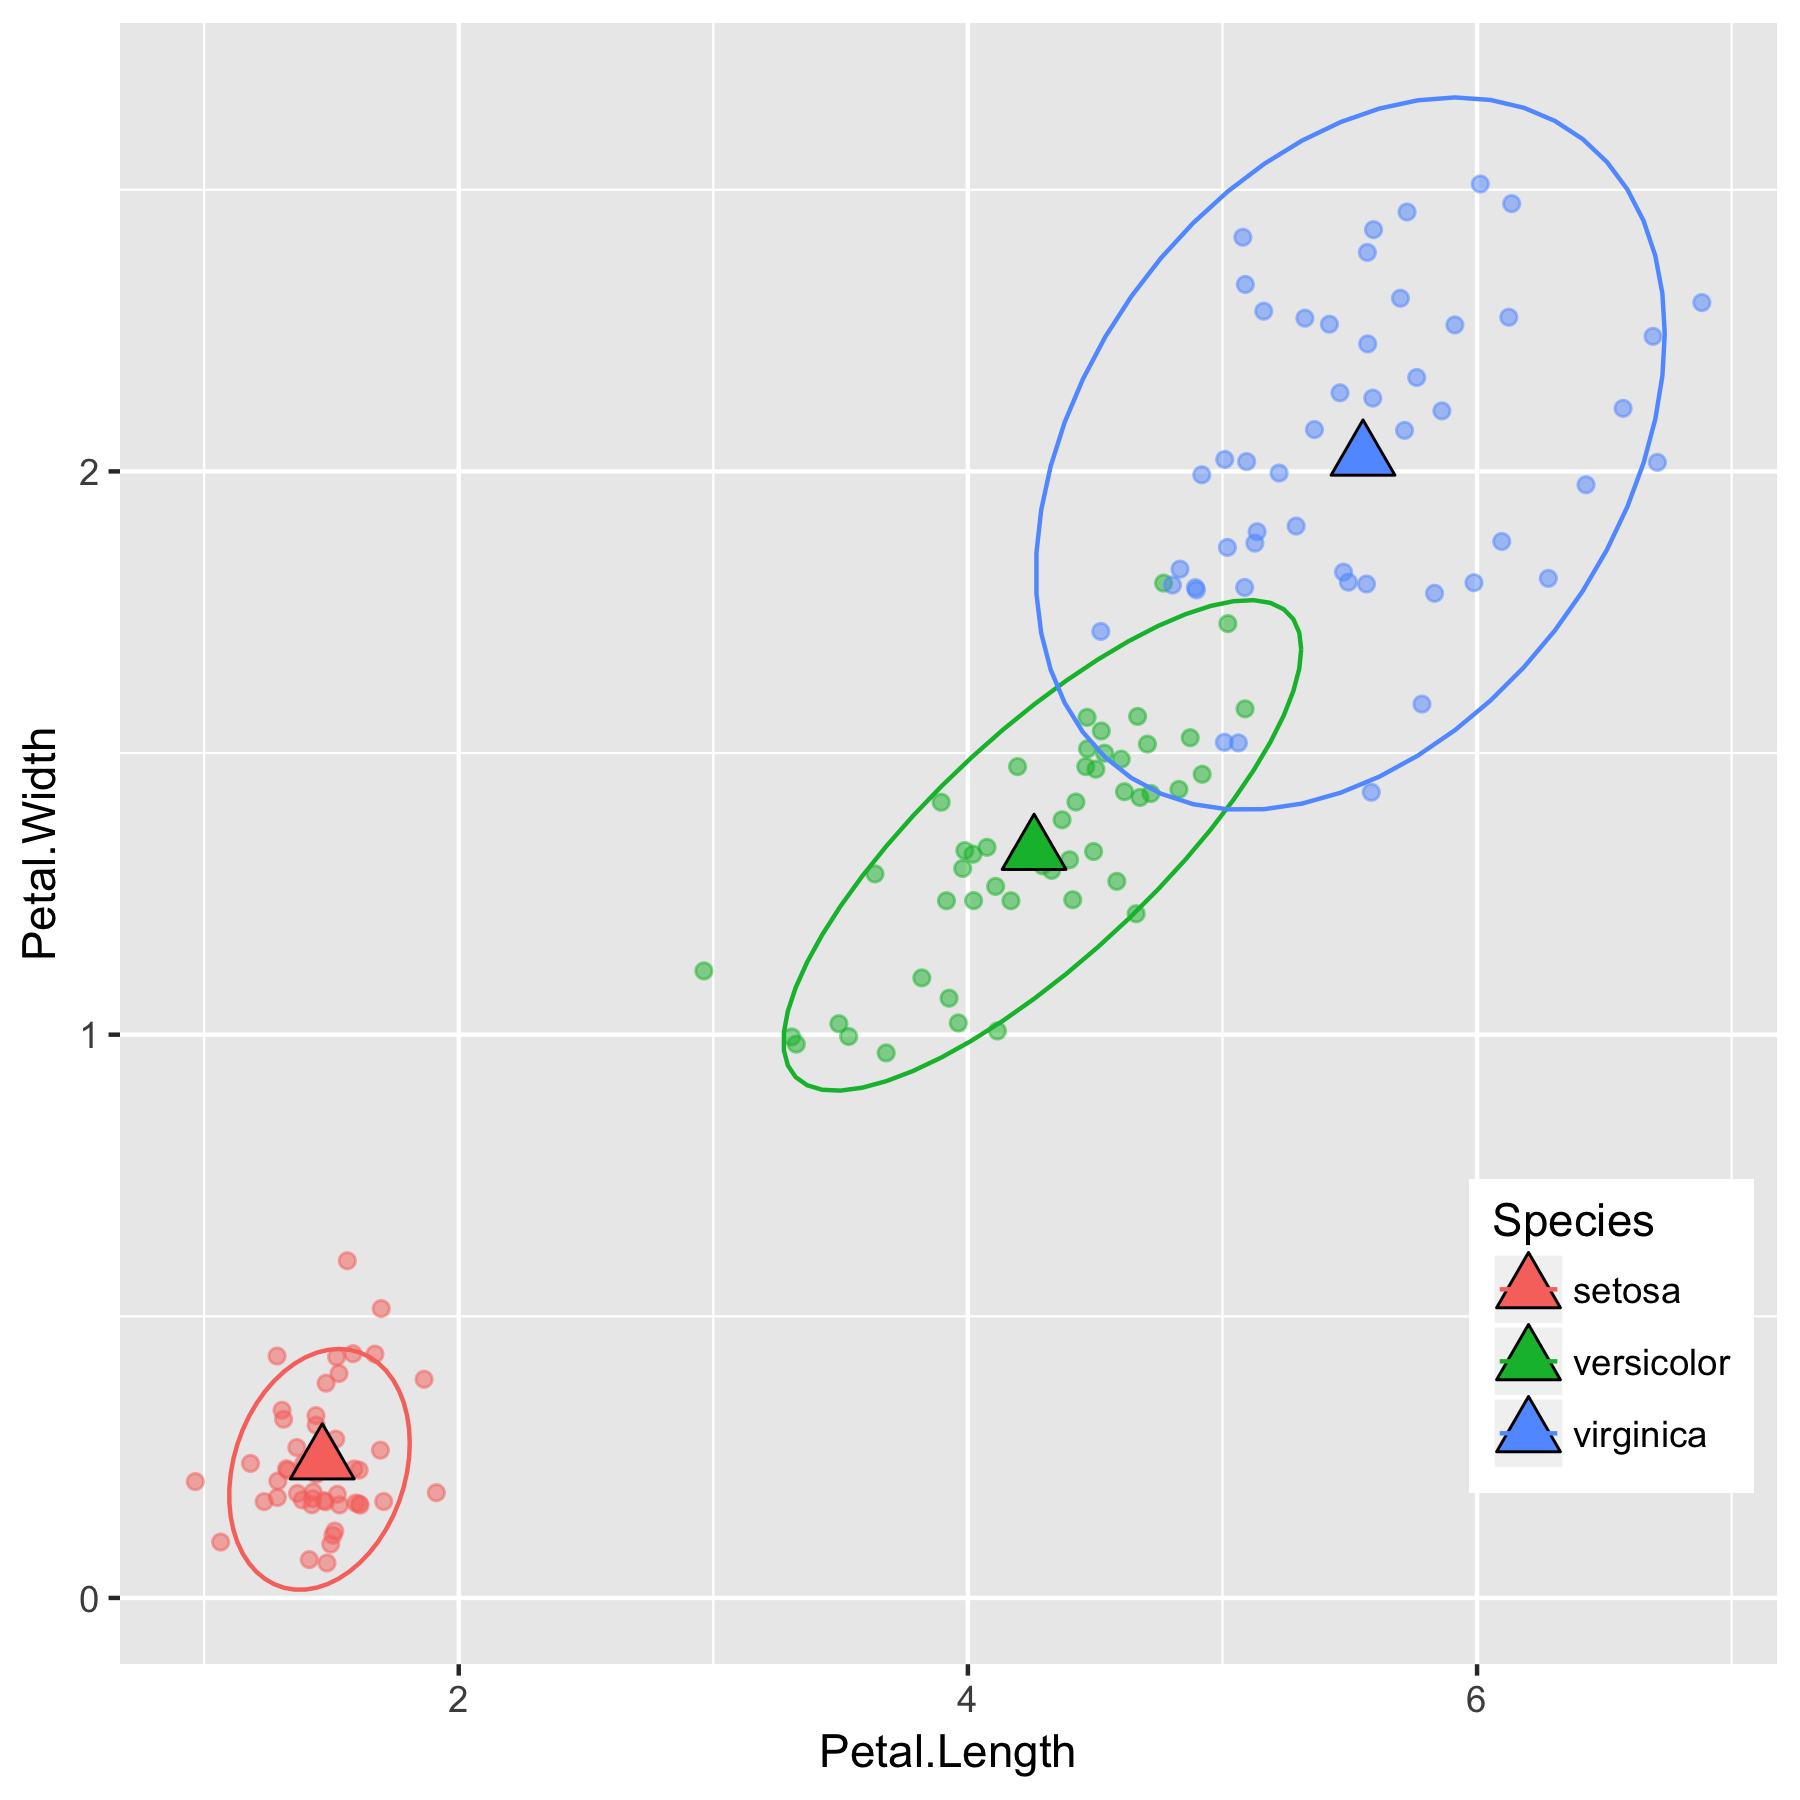
解讀變異數

setosa Petal.Length Petal.Width
Petal.Length 0.030 0.006
Petal.Width 0.006 0.011
versicolor Petal.Length Petal.Width
Petal.Length 0.221 0.073
Petal.Width 0.073 0.039
virginica Petal.Length Petal.Width
Petal.Length 0.305 0.049
Petal.Width 0.049 0.075

mean and variance

R 的多變量機率分配

一起來練習吧!

R 的多變量機率分配

Preparing Video For Download...