以 t 檢定比較平均數

R 數值資料推論

Mine Cetinkaya-Rundel

Associate Professor of the Practice, Duke University

更標準的薪資衡量

把比較年度平均 income,改為比較平均 hrly_rate

  • 假設一年有 52 週
  • hrly_rate = income / (hrs_work * 52)
R 數值資料推論

研究問題與假設

資料是否足以說明美國公民與非公民的平均時薪存在差異?

令 $\mu =$ 平均時薪

$H_0: \mu_{citizen} = \mu_{non-citizen}$

$H_A: \mu_{citizen} \ne \mu_{non-citizen}$

R 數值資料推論

摘要統計量

acs12 %>%
  filter(!is.na(hrly_rate)) %>%
  group_by(citizen) %>%
  summarise(x_bar = round(mean(hrly_rate), 2),
            s = round(sd(hrly_rate), 2),
            n = length(hrly_rate)) 
  citizen  x_bar      s   n
1 no       21.19  34.50  58
2 yes      18.52  24.73 901
R 數值資料推論

執行檢定

t.test(hrly_rate ~ citizen, data = acs12, null = 0, 
       alternative = "two.sided")
  • 虛無假設:
    • $H_0: \mu_{citizen} = \mu_{non-citizen}$
    • $H_0: \mu_{citizen} - \mu_{non-citizen} = 0$ $\rightarrow$ null = 0
  • $H_A: \mu_{citizen} \ne \mu_{non-citizen}$ $\rightarrow$ alternative = "two.sided"
R 數值資料推論

執行檢定

t.test(hrly_rate ~ citizen, data = acs12, null = 0, 
       alternative = "two.sided")
    Welch Two Sample t-test
data:  hrly_rate by citizen
t = 0.58058, df = 60.827, p-value = 0.5637
alternative hypothesis: true difference in means is not equal to 0
95 percent confidence interval:
 -6.53483 11.88170
sample estimates:
 mean in group no mean in group yes 
         21.19494          18.52151 
R 數值資料推論

條件

  • 獨立性:
    • 每個樣本內的觀測彼此獨立。
    • 兩個樣本彼此獨立。
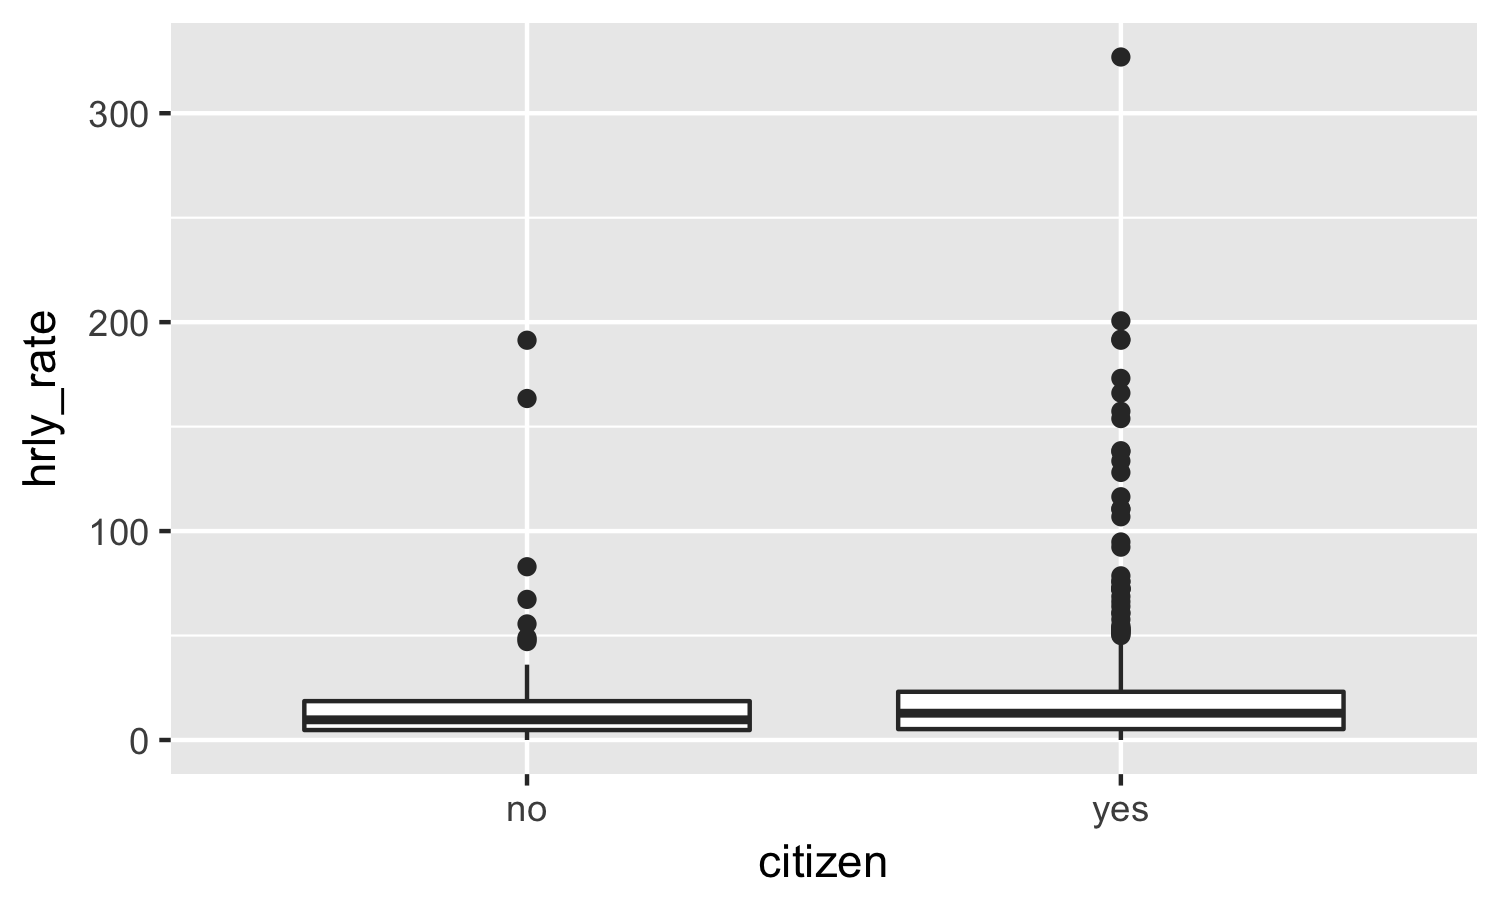
  • 樣本大小/偏態:原始資料越偏斜,為取得對稱的抽樣分配所需的樣本越大。

chp3-vid3-hrly-rate-citizen

R 數值資料推論

一起來練習吧!

R 數值資料推論

Preparing Video For Download...