R 平行程式設計
Nabeel Imam
Data Scientist
print(file_list)
 [1] "./uni_data_country/Argentina.csv"
 [2] "./uni_data_country/Armenia.csv"
 [3] "./uni_data_country/Australia.csv"
 [4] "./uni_data_country/Austria.csv"
 [5] "./uni_data_country/Azerbaijan.csv"
 [6] "./uni_data_country/Bahrain.csv"
 [7] "./uni_data_country/Bangladesh.csv"
 [8] "./uni_data_country/Belarus.csv"
 [9] "./uni_data_country/Belgium.csv"
[10] "./uni_data_country/Bolivia.csv"
...
for (file in file_list) {

  df <- read.csv(file)


  df$top100 <- NA

  for (r in 1:nrow(df)) {
    df$top100[r] <- df$world_rank[r] <= 100
  }


  write.csv(df, file)
}
for (file in file_list) { df <- read.csv(file)
df$top100 <- NA for (r in 1:nrow(df)) { df$top100[r] <- df$world_rank[r] <= 100 }
write.csv(df, file) }
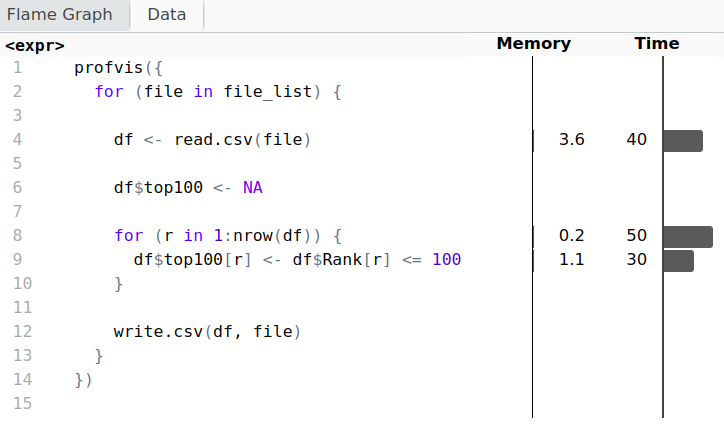
library(profvis)


profvis({

  for (file in file_list) {

    df <- read.csv(file)
    df$top100 <- NA

    for (r in 1:nrow(df)) {
      df$top100[r] <- df$Rank[r] <= 100
    }
    write.csv(df, file)
  }

})
library(profvis)
profvis({
  for (file in file_list) {

    df <- read.csv(file)
    df$top100 <- NA

    for (r in 1:nrow(df)) {
      df$top100[r] <- df$Rank[r] <= 100
    }
    write.csv(df, file)
  }
})
add_col <- function(file_path) {

  df <- read.csv(file_path)
  df$top100 <- NA

  for (r in 1:nrow(df)) {
    df$top100[r] <- df$Rank[r] <= 100
  }
  write.csv(df, file_path)
}


cl <- makeCluster(6)

dummy <- parLapply(cl, file_list, add_col)
stopCluster(cl)
add_col <- function(file_path) { df <- read.csv(file_path) df$top100 <- NA for (r in 1:nrow(df)) { df$top100[r] <- df$Rank[r] <= 100 } write.csv(df, file_path) }
cl <- makeCluster(6)
dummy <- parLapply(cl, file_list, add_col) stopCluster(cl)
detectCores()
[1] 8
cl <- makeCluster(detectCores() - 2)


dummy <- parLapply(cl, file_list, add_col)

stopCluster(cl)
cl <- makeCluster(detectCores() - 2)
cl <- makeCluster(detectCores() - 2,
                  type = "FORK")