以主成分進行迴歸分析
R 的行銷分析機器學習

Verena Pflieger
Data Scientist at INWT Statistics
迴歸分析中的主成分 I
mod1 <- lm(customerSatis ~ ., dataCustomers)library(car) vif(mod1)
      nOrders       nItemsOrdered          nItemsSold        salesOrdered
    29.482287           24.437448           10.390998            5.134720
    salesSold         returnRatio       shareOwnBrand           shareSale
     9.685617           23.778800            1.571607            1.178773
 shareVoucher          crDuration monetaryReturnRatio  meanDaysBetwOrders
     1.213011            1.757509           10.632243            1.698369
salesPerOrder        salesPerItem       itemsPerOrder   itemsSoldPerOrder
     6.563474            4.557981            4.821610           15.949072
# Create dataframe with customer satisfaction and first 6 components
dataCustComponents <- cbind(dataCustomers[, "customerSatis"],
                            pcaCust$x[,1:6]) %>%
  as.data.frame
mod2 <- lm(customerSatis ~ ., dataCustComponents)
vif(mod2)
PC1 PC2 PC3 PC4 PC5 PC6
  1   1   1   1   1   1
summary(mod1)$adj.r.squared
0.8678583
summary(mod2)$adj.r.squared
0.7123822
summary(mod2)
Call:
lm(formula = customerSatis ~ ., data = dataCustComponents)
Residuals:
    Min      1Q  Median      3Q     Max
-3.9279 -0.2411  0.0179  0.2865  1.4972
Coefficients:
             Estimate Std. Error t value Pr(>|t|)
(Intercept)  2.985945   0.014039 212.682  < 2e-16 ***
PC1         -0.175434   0.006704 -26.167  < 2e-16 ***
PC2          0.296659   0.007643  38.815  < 2e-16 ***
PC3         -0.012816   0.010838  -1.182    0.237
PC4         -0.116651   0.011665 -10.000  < 2e-16 ***
PC5          0.101963   0.012508   8.152 1.09e-15 ***
PC6          0.126677   0.013072   9.691  < 2e-16 ***
- - -
Signif. codes:  0 '***' 0.001 '**' 0.01 '*' 0.05 '.' 0.1 ' ' 1
Residual standard error: 0.4415 on 982 degrees of freedom
Multiple R-squared:  0.7141,    Adjusted R-squared:  0.7124
F-statistic: 408.9 on 6 and 982 DF,  p-value: < 2.2e-16
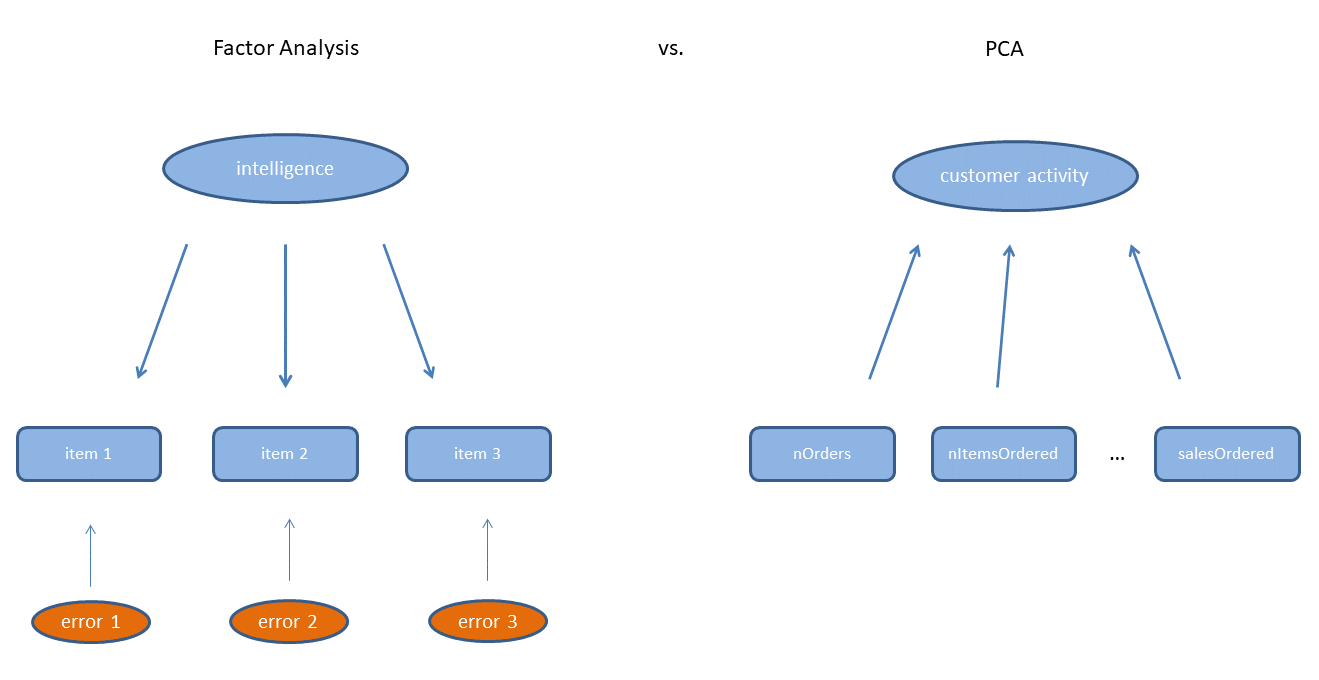
| PCA 重點整理 | |
|---|---|
| 你已學到…… | 在不損失太多資訊下減少變數數量 |
| 在做 PCA 前應先標準化變數 | |
| 如何決定相關主成分的數量 | |
| 如何解讀選出的主成分 |
| 模型帶來的啟發 | |
|---|---|
| 你已學到…… | 原始變數可濃縮為 6 個主成分,如顧客活動、退貨行為、品牌認知等 |
| 用前 6 個主成分解釋顧客滿意度會降低解釋變異,但可解決多重共線性問題 |
一起來練習吧!
R 的行銷分析機器學習

