選擇適當的主成分數

R 的行銷分析機器學習

Verena Pflieger

Data Scientist at INWT Statistics

相關成分數:解釋變異

# Proportion of variance explained:
summary(pcaCust)
Importance of components:
                          PC1    PC2    PC3     PC4     PC5     PC6     PC7
Standard deviation     2.0951 1.8379 1.2960 1.20415 1.12301 1.07453 0.80486
Proportion of Variance 0.2743 0.2111 0.1050 0.09062 0.07882 0.07216 0.04049
Cumulative Proportion  0.2743 0.4855 0.5904 0.68106 0.75989 0.83205 0.87254
                           PC8     PC9    PC10    PC11    PC12    PC13
Standard deviation     0.78236 0.72452 0.61302 0.48428 0.36803 0.25901
Proportion of Variance 0.03826 0.03281 0.02349 0.01466 0.00847 0.00419
Cumulative Proportion  0.91079 0.94360 0.96709 0.98175 0.99021 0.99440
                          PC14    PC15    PC16
Standard deviation     0.20699 0.17126 0.13170
Proportion of Variance 0.00268 0.00183 0.00108
Cumulative Proportion  0.99708 0.99892 1.00000
R 的行銷分析機器學習

相關成分數:Kaiser-Guttman 準則

Kaiser-Guttman 準則:Eigenvalue > 1

pcaCust$sdev ^ 2
 [1] 4.38961593 3.37778445 1.67965616 1.44997580 1.26115351 1.15461579
 [7] 0.64780486 0.61209376 0.52492468 0.37579685 0.23452736 0.13544710
[13] 0.06708362 0.04284504 0.02933027 0.01734481
R 的行銷分析機器學習

相關成分數:screeplot

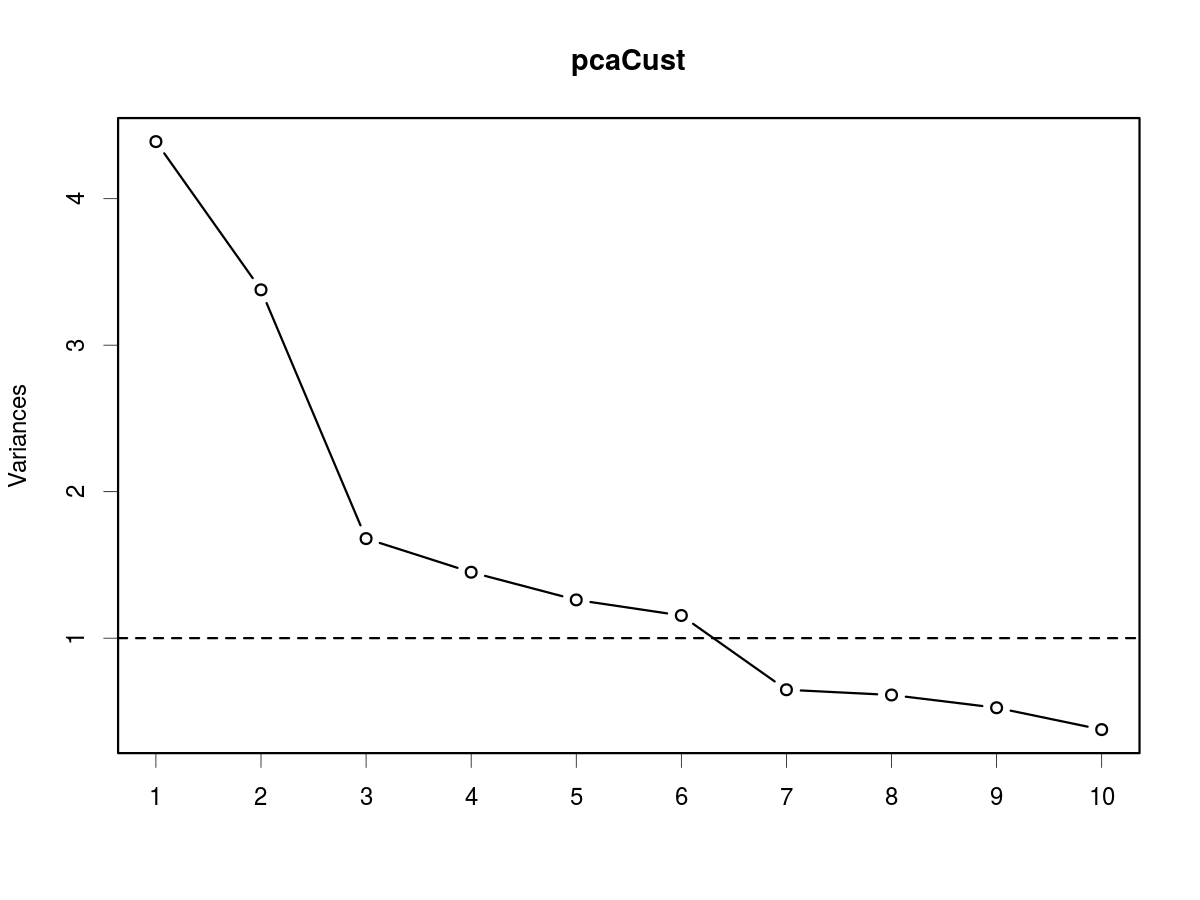
Screeplot,也就是「找折點」

screeplot(pcaCust, type = "lines")
box()
abline(h = 1, lty = 2)
R 的行銷分析機器學習

各準則建議的成分數

解釋變異 Kaiser-Guttman Screeplot
5 6 6
R 的行銷分析機器學習

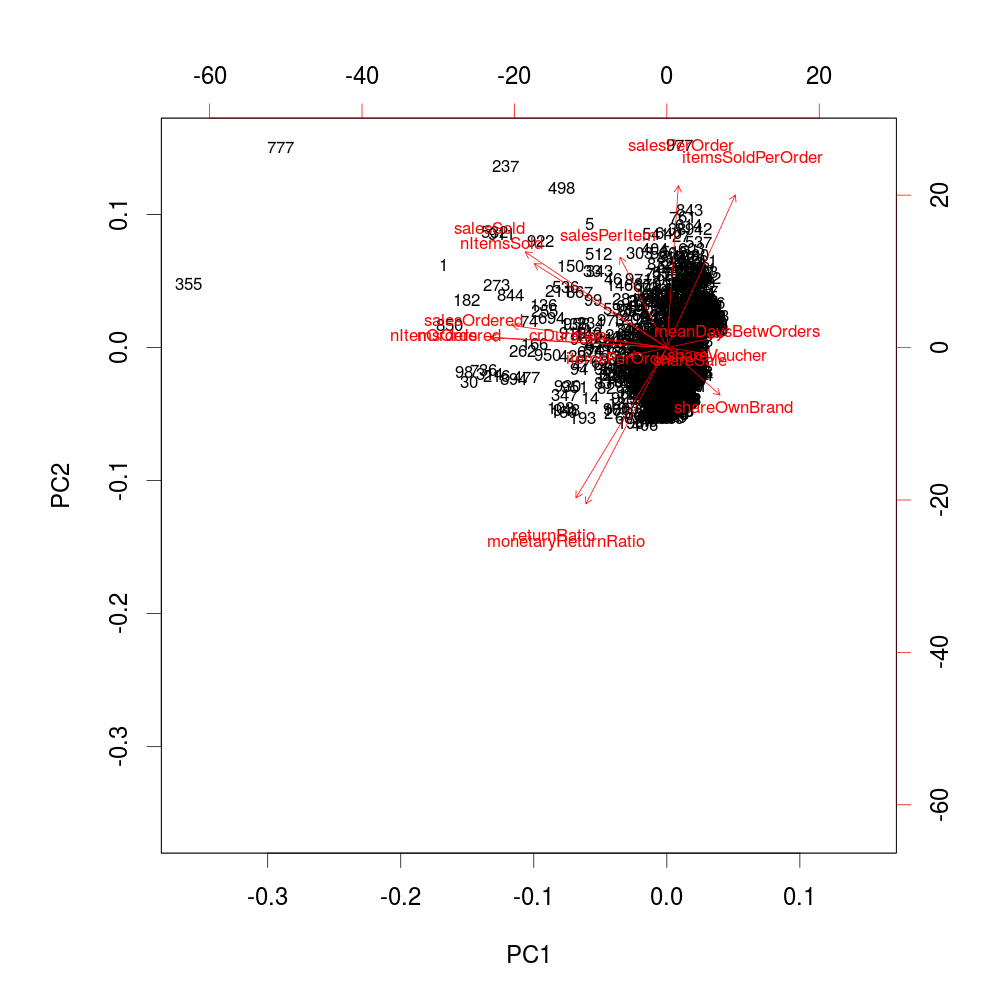
Biplot

biplot(pcaCust, choices = 1:2, cex = 0.7)
R 的行銷分析機器學習

一起來練習吧!

R 的行銷分析機器學習

Preparing Video For Download...