特徵雜湊

R 的特徵工程

Jorge Zazueta

Research Professor and Head of the Modeling Group at the School of Economics, UASLP

什麼是特徵雜湊?

  • 將文字變數轉為多個數值變數
  • 使用「雜湊值」作為特徵索引
  • 低記憶體的資料表示法
  • 當新資料出現新類別時特別實用

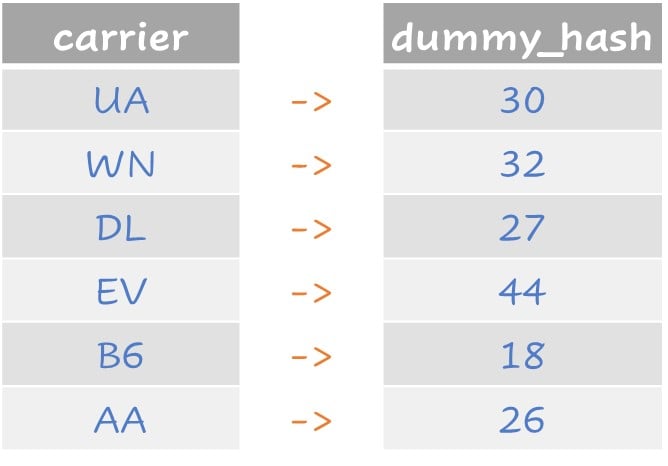
依文字值為每個航空公司指派索引號。

示意航空公司特徵雜湊的表格。

R 的特徵工程

有多少家航空公司?

flights 資料集包含航空公司做為因子,但我們無法確定在新資料中是否會出現新的航空公司。

flights %>%
  select(carrier) %>%
  table()
carrier
  9E   AA   AS   B6   DL   EV   F9   FL   HA   MQ   OO   UA   US   VX   WN   YV 
 859 1744   26 2503 2619 3014   38  186   14 1540    2 3367 1228  244  757   41
R 的特徵工程

來對這個特徵做雜湊

我們可以建立 dummy 雜湊來表示因子值。使用 textrecipes 套件。

recipe <- recipe(~carrier, 
                 data = flights_train) %>%
  step_dummy_hash(carrier, prefix = NULL, 
                  signed = FALSE, 
                  num_terms = 50L)
# Prep the recipe
object <- recipe %>%
  prep()

# Bake the recipe object with new data
baked <- bake(object,
              new_data = flights_test)

快速一瞥 step_dummy_hash() 的表示法。

bind_cols(flights_test$carrier,baked)[1:6,c(1,18:20)]
New names:
• `` -> `...1`
# A tibble: 10 × 4
   ...1  `_carrier_17` `_carrier_18` `_carrier_19`
   <chr>         <int>         <int>         <int>
 1 EV                0             0             0
 2 B6                0             1             0
 3 EV                0             0             0
 4 MQ                0             0             0
 5 DL                0             0             0
 6 EV                0             0             0
R 的特徵工程

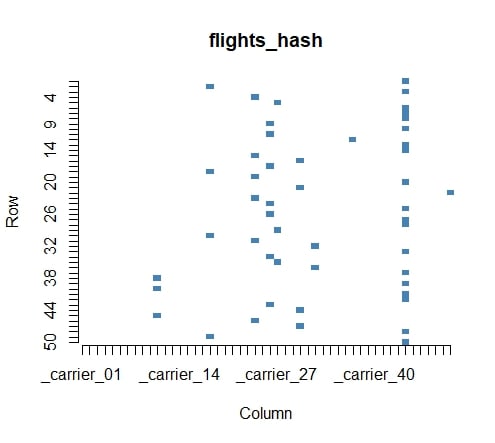
雜湊視覺化

我們可以用 plot.matrix 套件來檢視矩陣。

flights_hash <- 
    as.matrix(baked)[1:50,] 

plot(flights_hash, 
     col = c("white","steelblue"), 
     key = NULL,
     border = NA)

原始航空公司因子的部分 dummy 雜湊指派之圖形化呈現。

R 的特徵工程

一起來練習吧!

R 的特徵工程

Preparing Video For Download...