為摘要加入更多細節
使用 R 的 Trelliscope 視覺化巨量資料

Ryan Hafen
Author, TrelliscopeJS
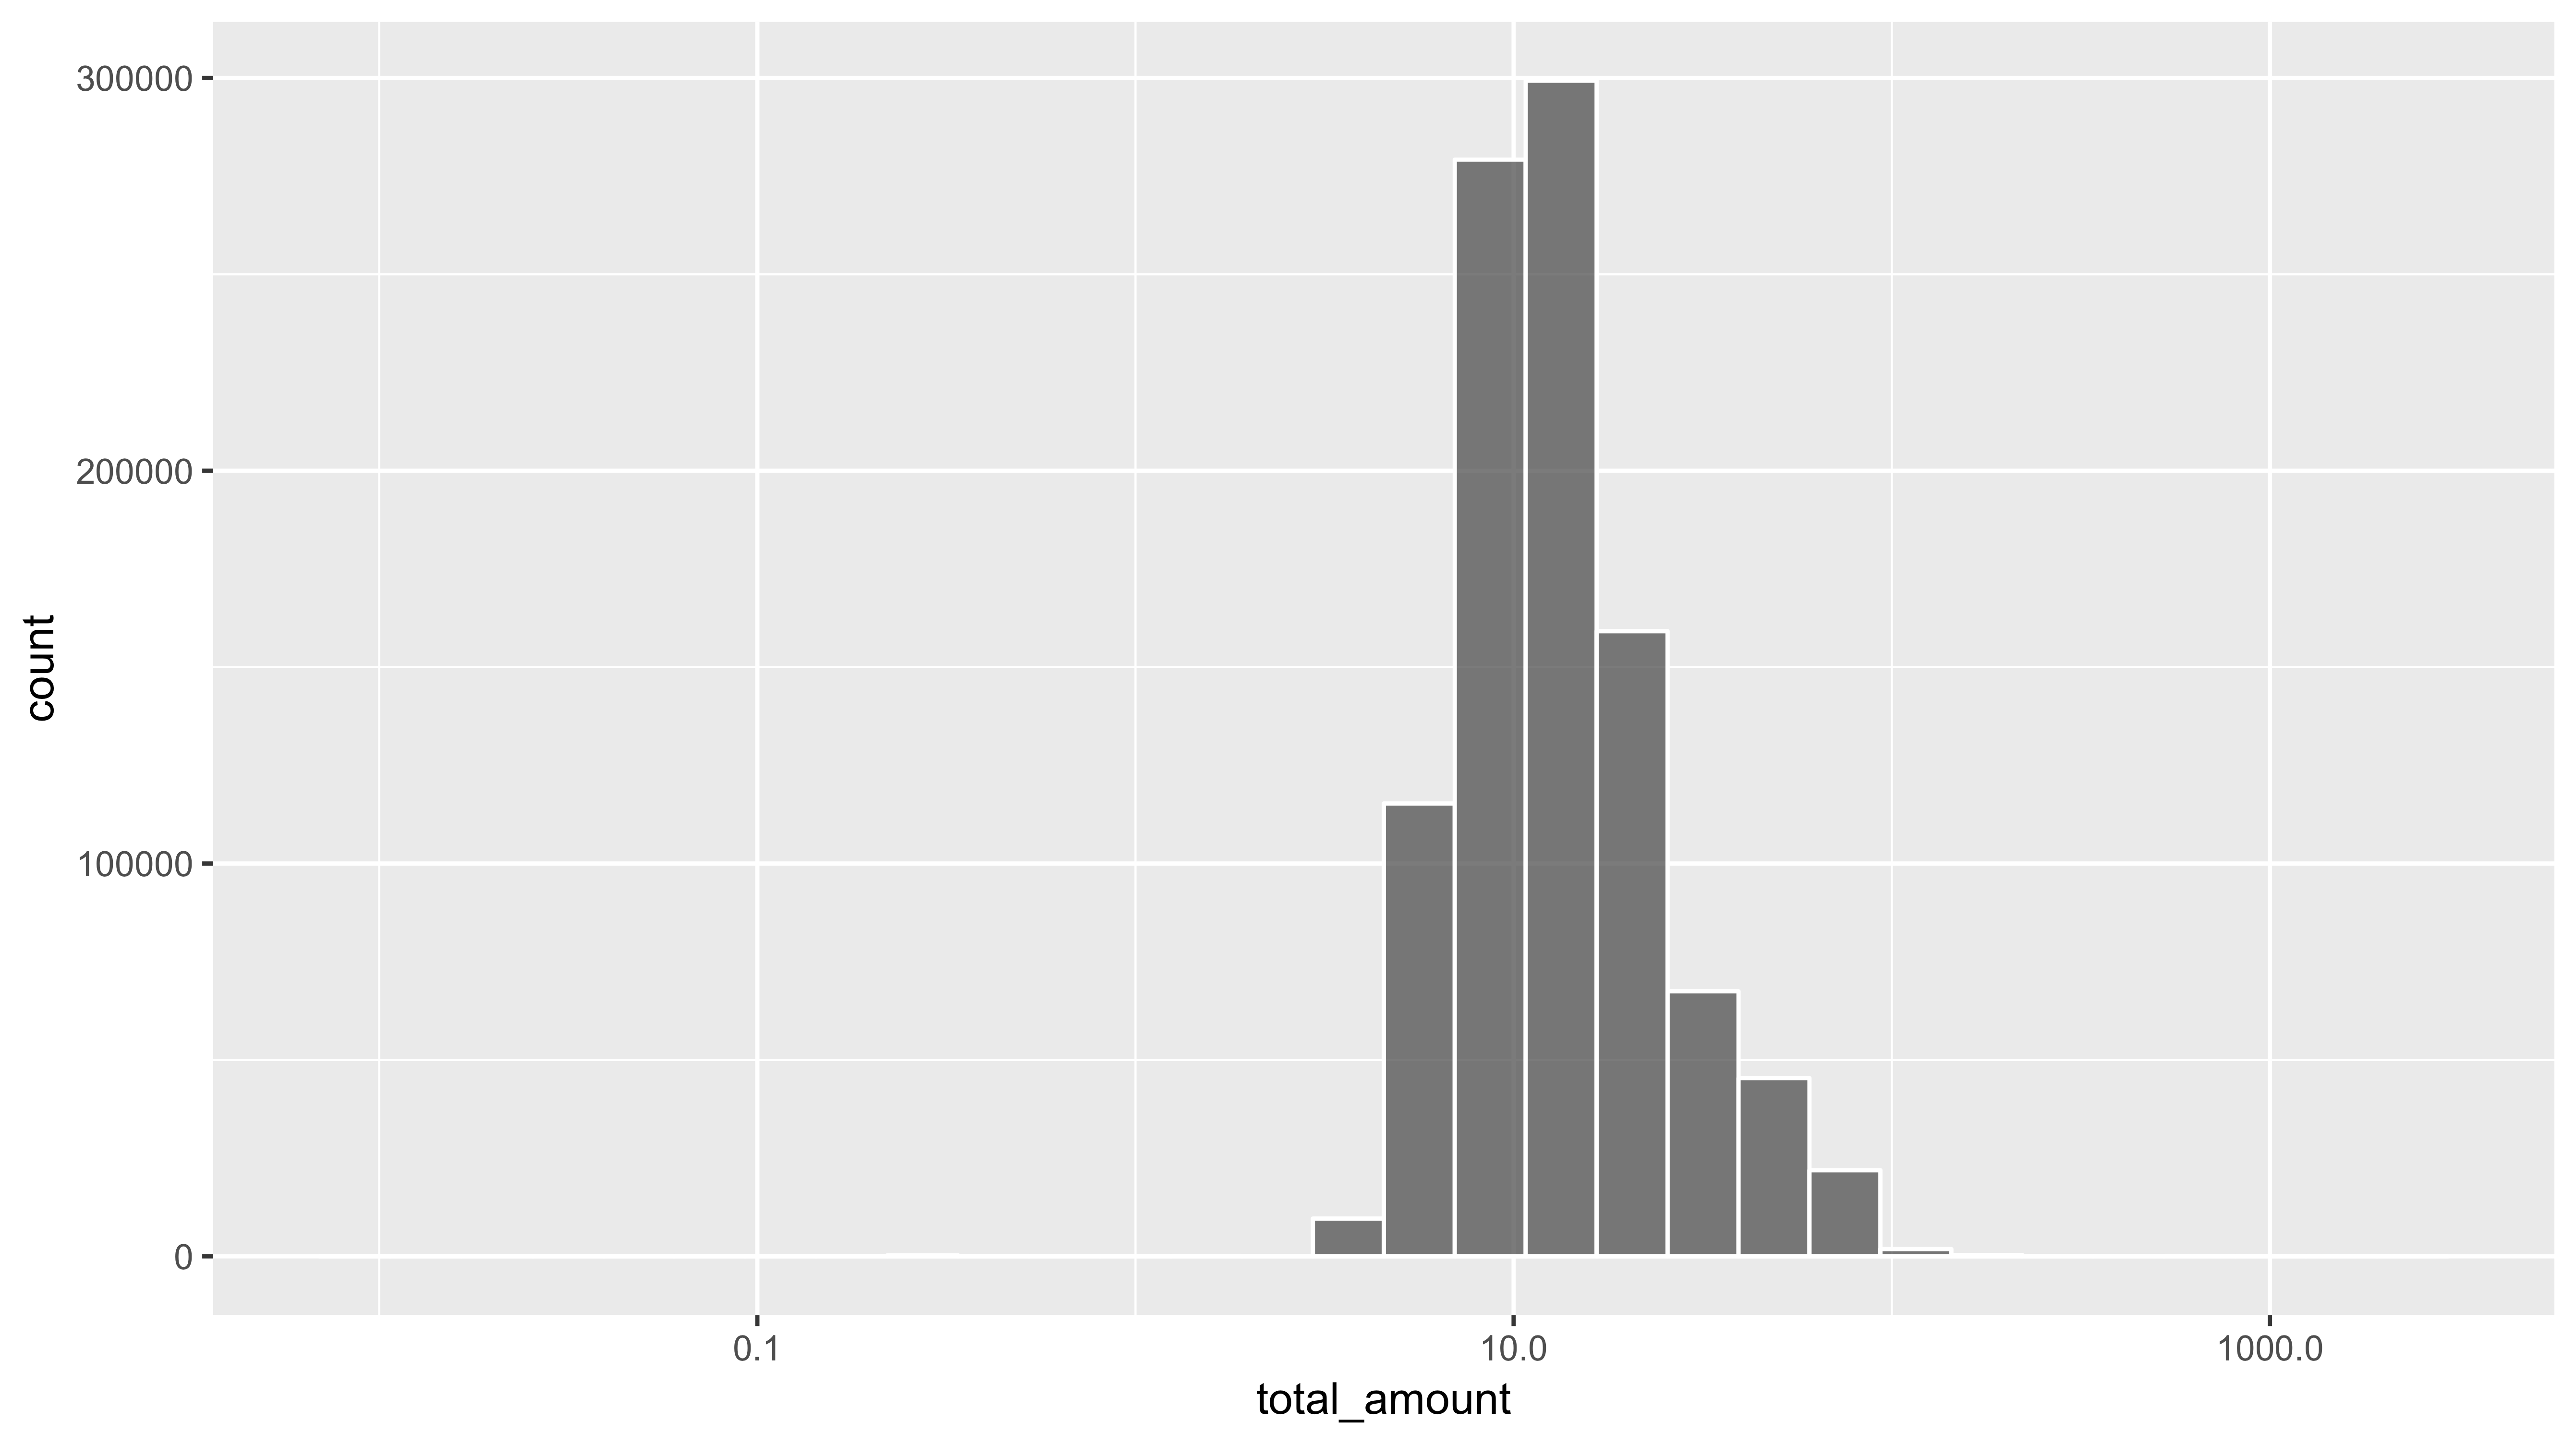
總車資分布
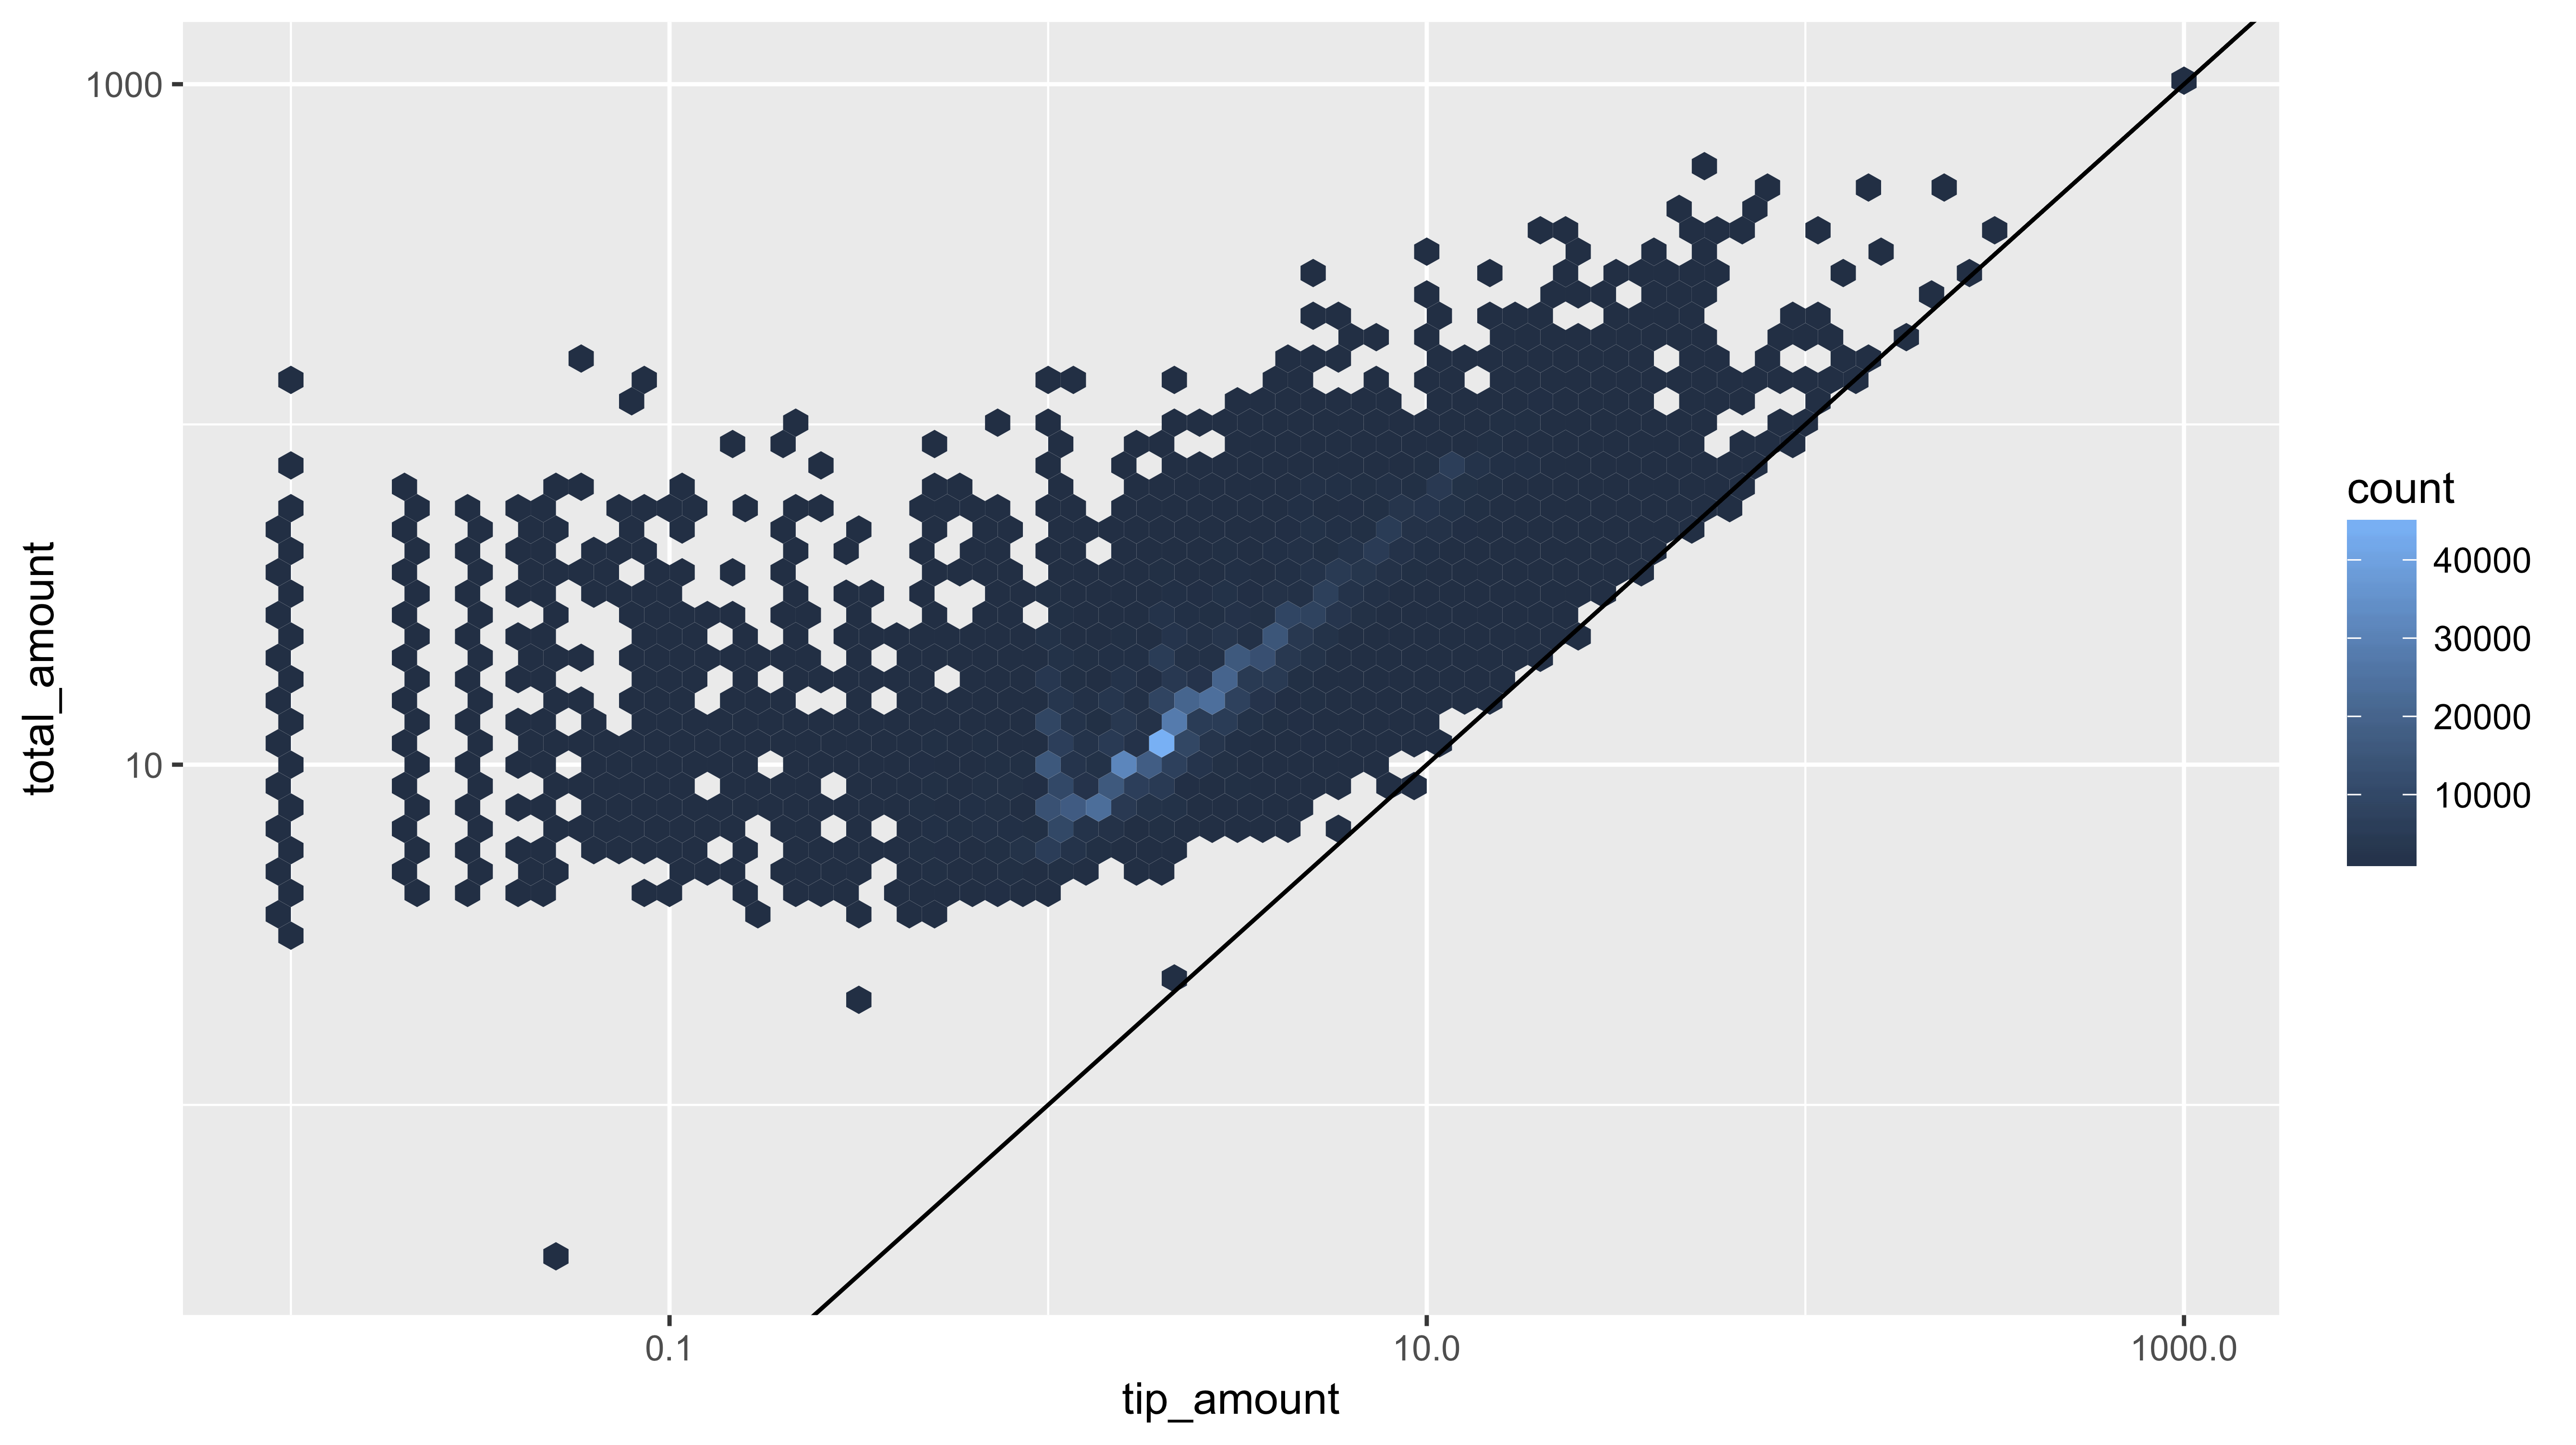
使用 geom_hex() 對連續變數分箱
ggplot(tx, aes(tip_amount, total_amount)) +geom_hex(bins = 75) + scale_x_log10() + scale_y_log10() + geom_abline(slope = 1, intercept = 0)
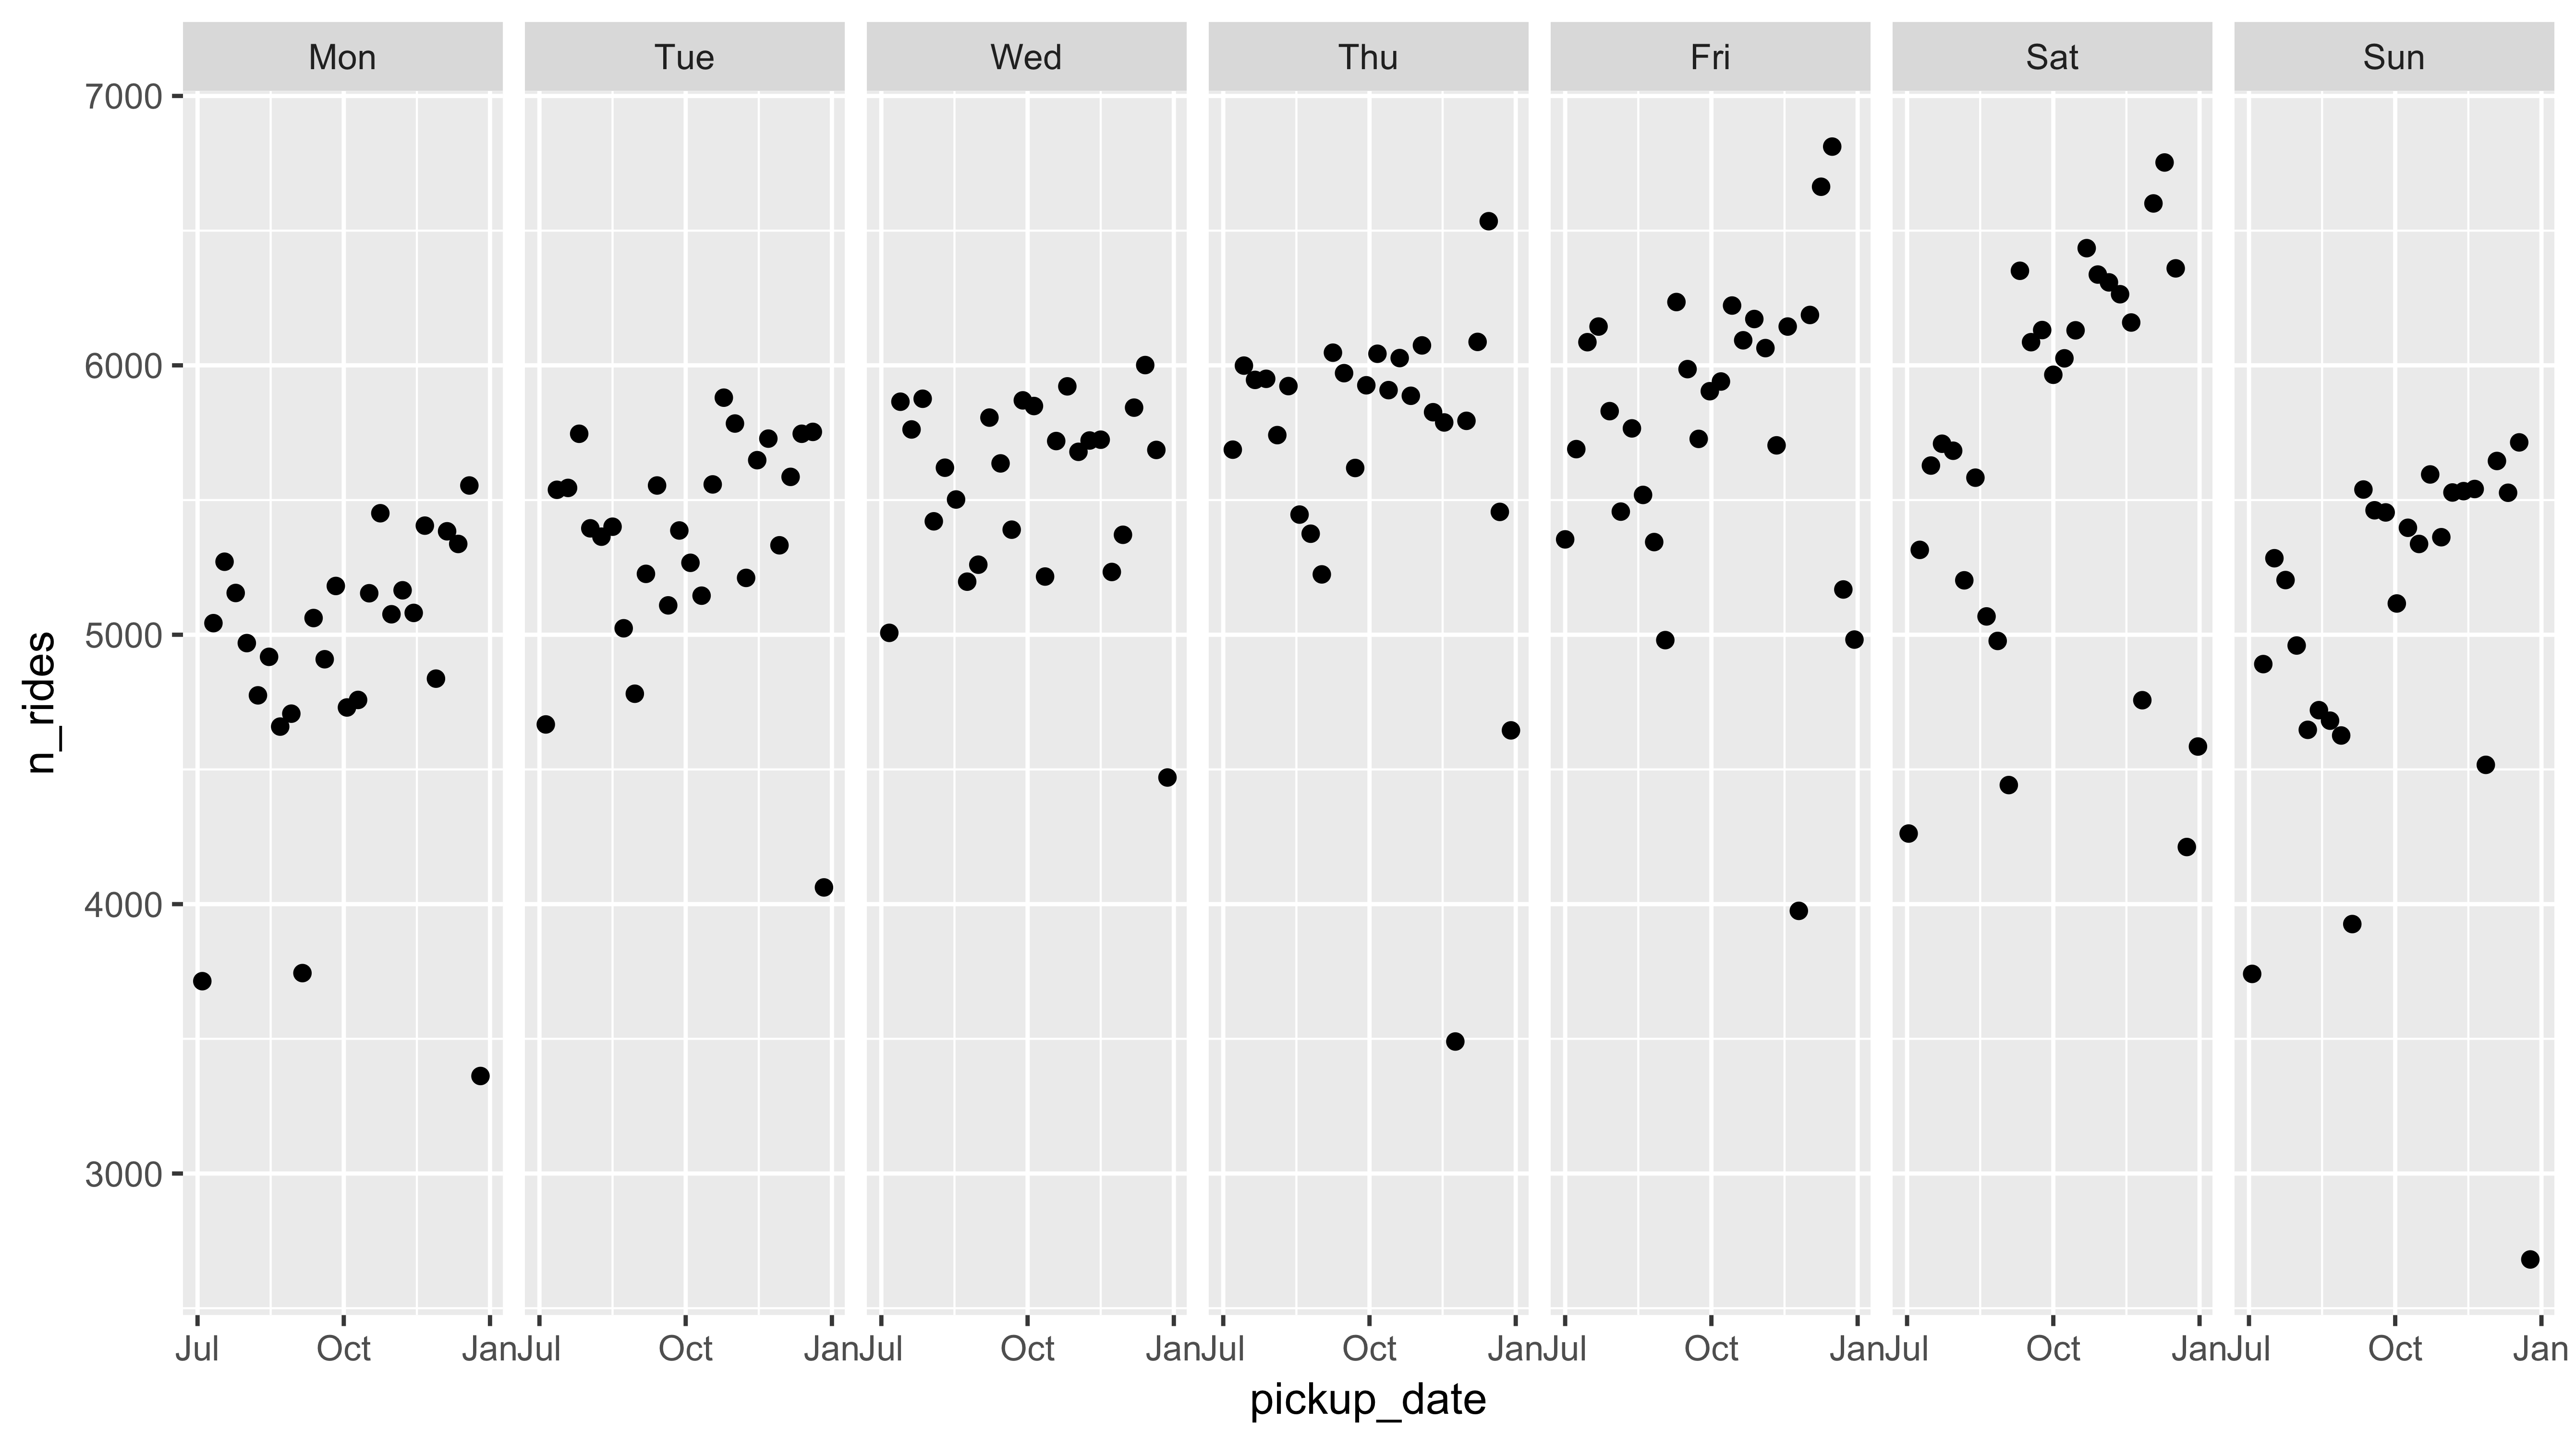
使用 facet_wrap() 分面
ggplot(daily_count, aes(pickup_date, n_rides)) +
  geom_point() +
  facet_wrap(~ pickup_dow)
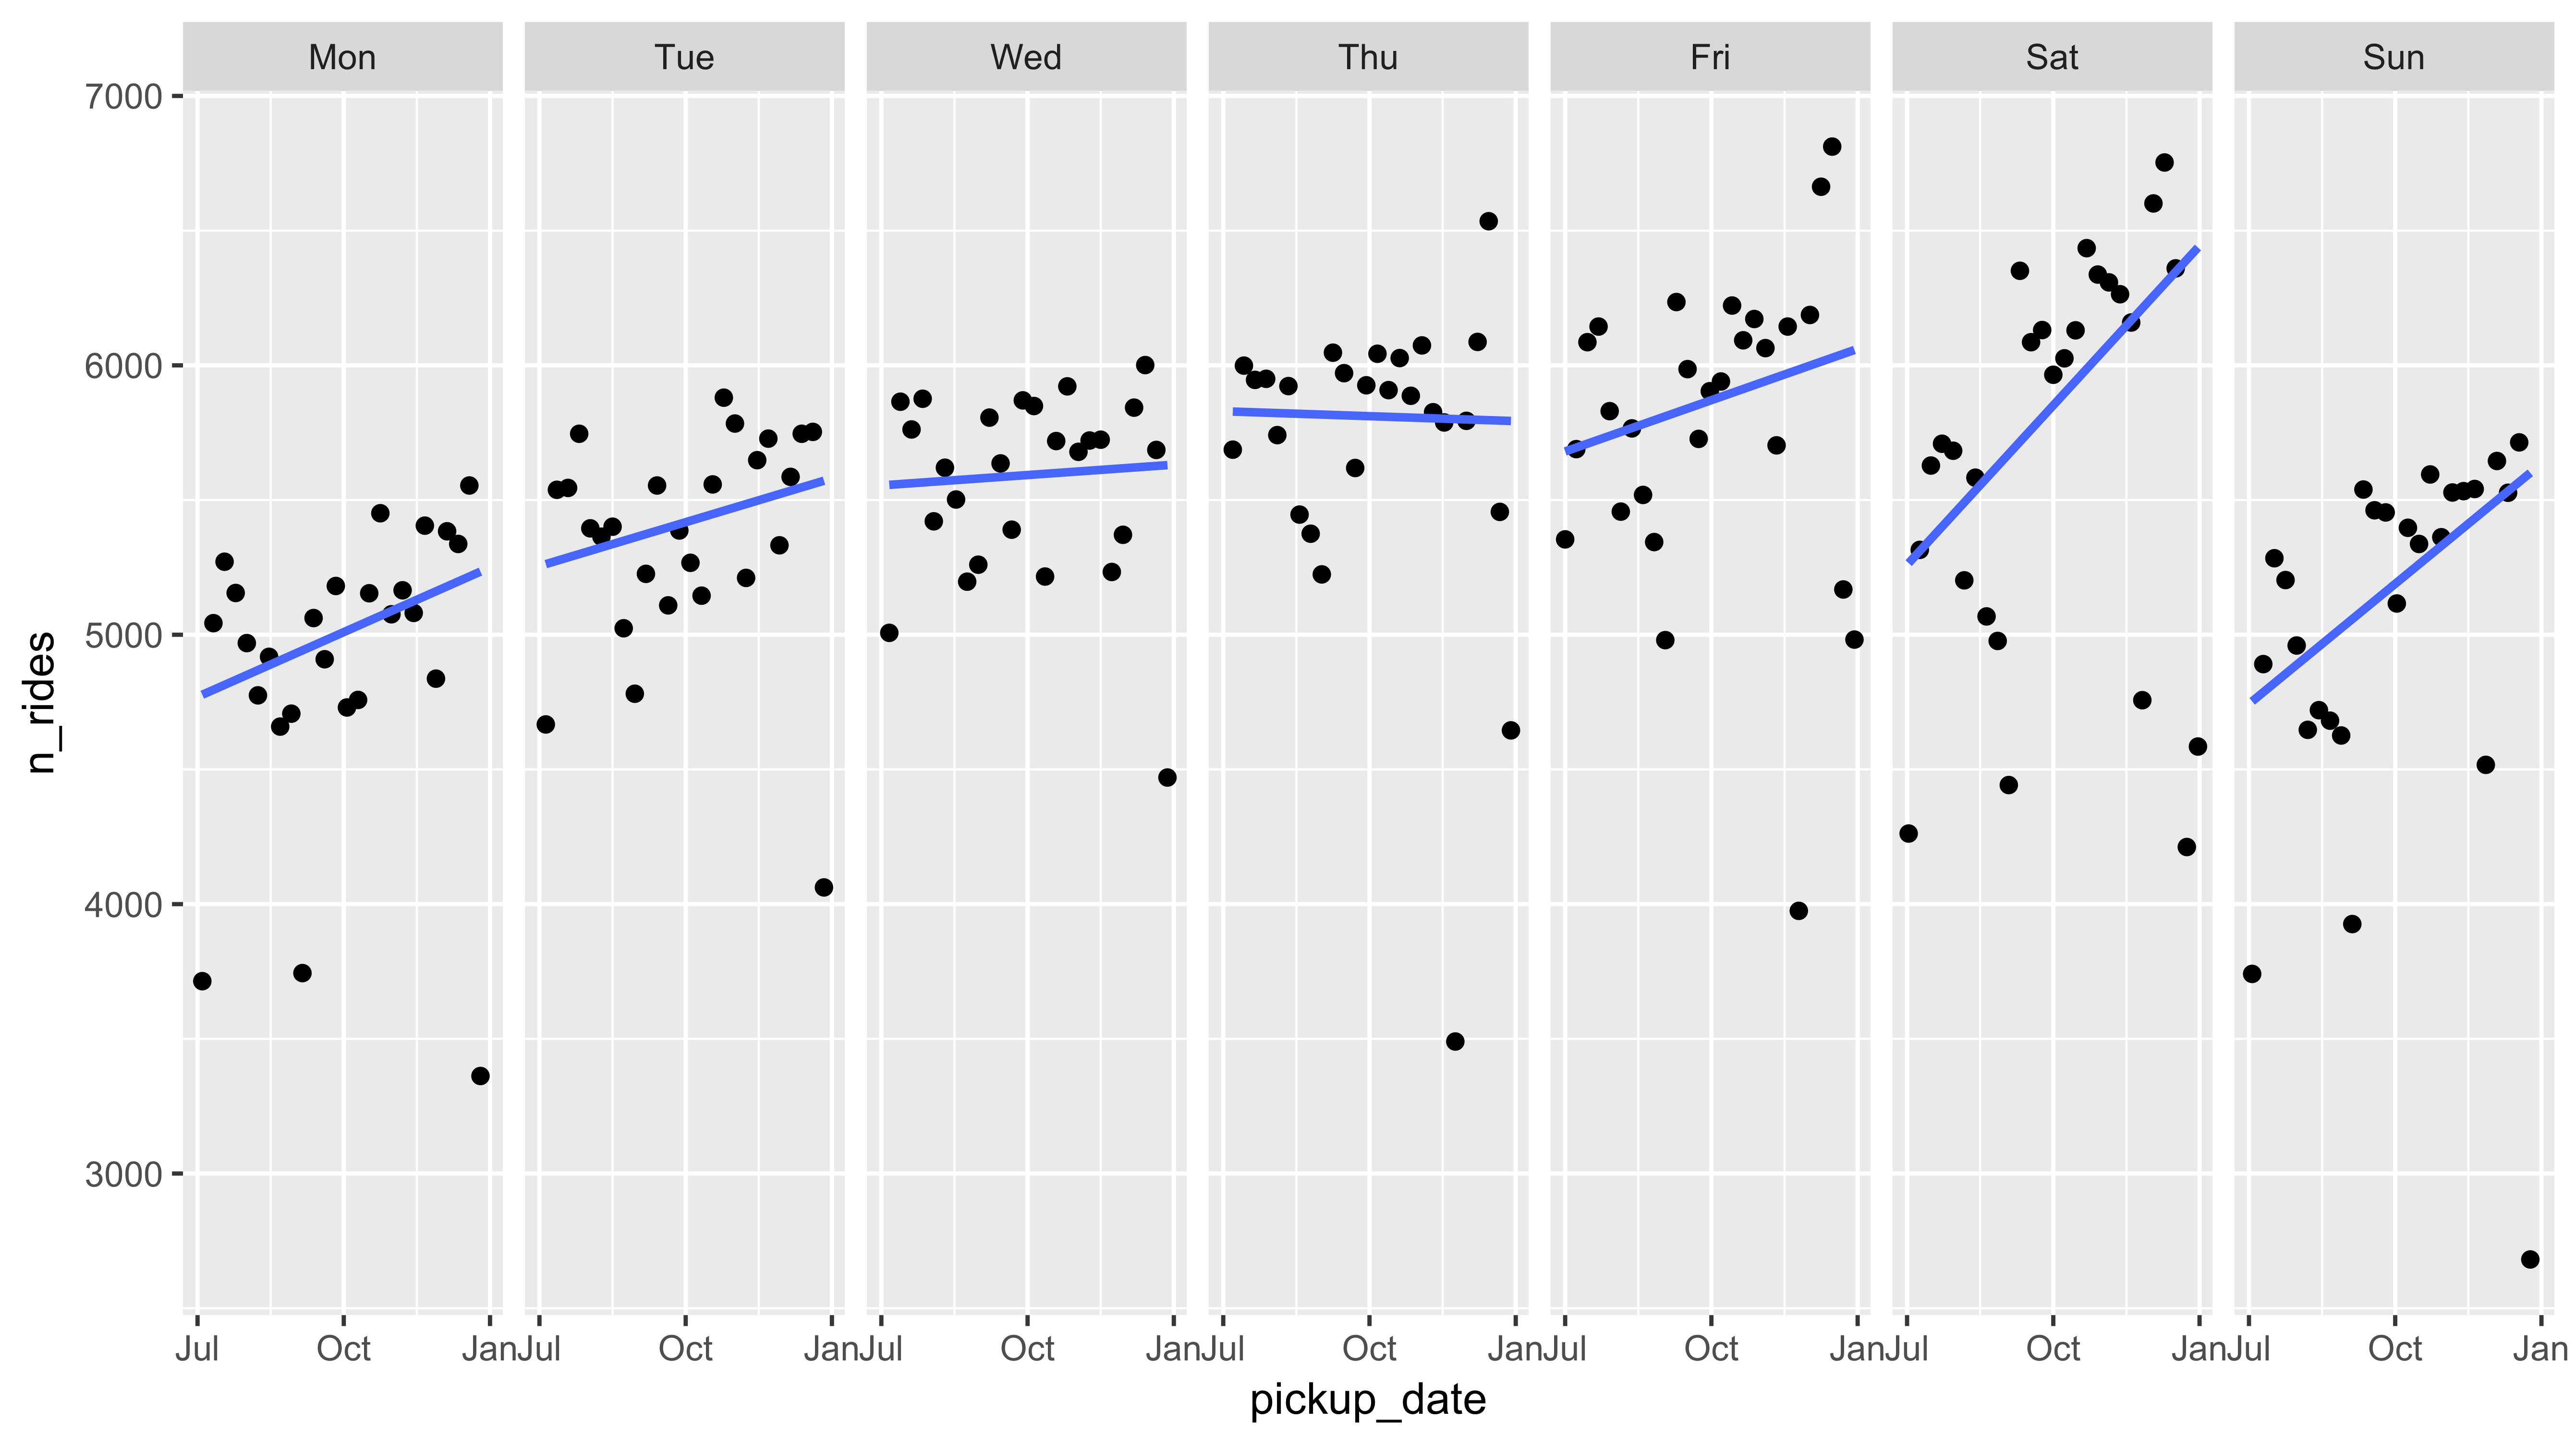
分面圖
ggplot(daily_count, aes(pickup_date, n_rides)) +
  geom_point() +
  facet_grid(~ pickup_dow) +
  geom_smooth(method = "rlm", se = FALSE)