自訂 tigris 選項

在 R 中分析美國人口普查資料

Kyle Walker

Instructor

Cartographic boundary 形狀檔

  • TIGER/Line 形狀檔包含實體的「水域」
    • 主題地圖可能不適用
  • 替代方案:cartographic boundary 形狀檔
    • 在 tigris 中以引數 cb = TRUE 取得
在 R 中分析美國人口普查資料

TIGER/Line 與 cartographic boundary 檔案

ri_tiger <- counties("RI")
ri_cb <- counties("RI", cb = TRUE)

par(mfrow = c(1, 2)) plot(ri_tiger, main = "TIGER/Line") plot(ri_cb, main = "Cartographic boundary")
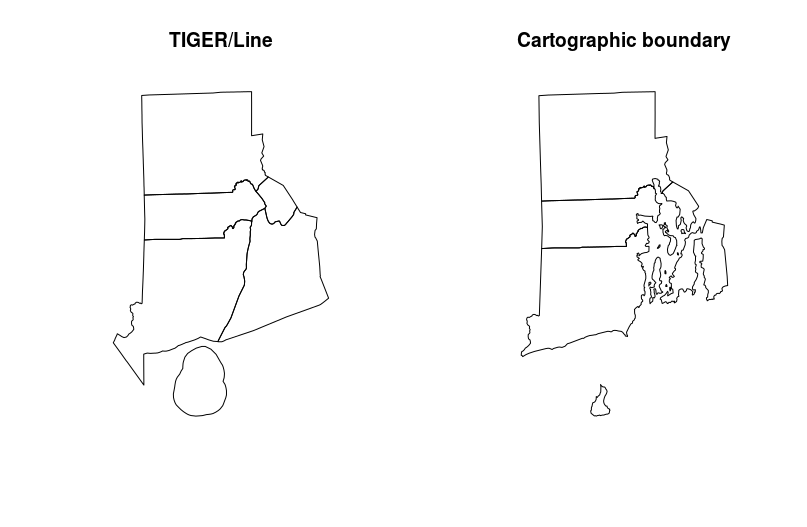
羅德島比較

在 R 中分析美國人口普查資料

tigris 與 simple features

options(tigris_class = "sf")
az_sf <- counties("AZ", cb = TRUE)
class(az_sf)
"sf"         "data.frame"
st_geometry(az_sf)
Geometry set for 15 features 
geometry type:  MULTIPOLYGON
dimension:      XY
bbox:           xmin: -114.8165 ymin: 31.33218 xmax: -109.0452 ymax: 37.00426
epsg (SRID):    4269
proj4string:    +proj=longlat +datum=NAD83 +no_defs
在 R 中分析美國人口普查資料

快取 tigris 資料

  • 下載大型 Census 形狀檔很花時間!
  • 可用替代:options(tigris_use_cache = TRUE)
  • 設定快取目錄:tigris_cache_dir() 函式
在 R 中分析美國人口普查資料

歷史資料與 tigris

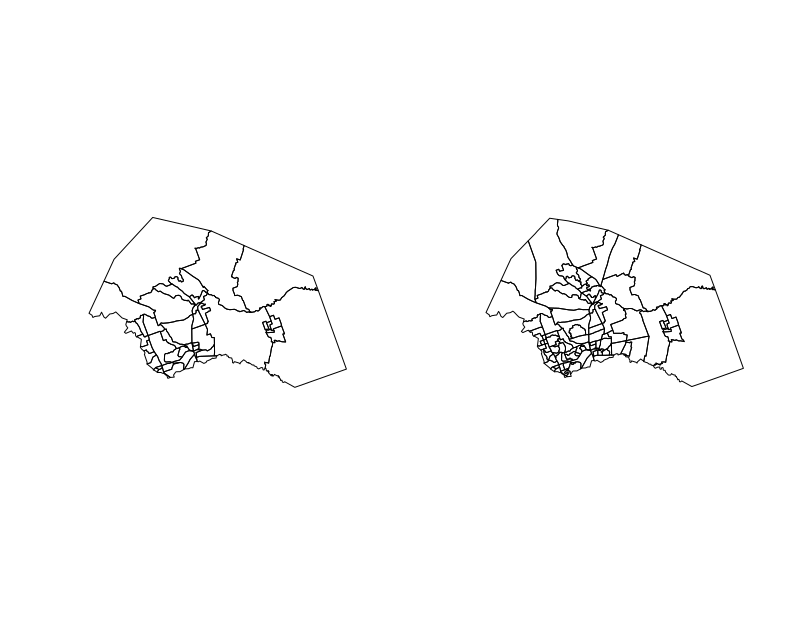
  • tigris 中可用 year 參數取得歷史資料
  • 可用年份:1990、2000、2010,以及 2011–2017
williamson90 <- tracts(state = "TX", county = "Williamson", 
                       cb = TRUE, year = 1990)

williamson16 <- tracts(state = "TX", county = "Williamson", 
                       cb = TRUE, year = 2016)

par(mfrow = c(1, 2))
plot(williamson90$geometry)
plot(williamson16$geometry)
在 R 中分析美國人口普查資料

威廉森郡比較

在 R 中分析美國人口普查資料

一起來練習吧!

在 R 中分析美國人口普查資料

Preparing Video For Download...