有標記的異常

R 中的異常偵測入門

Alastair Rushworth

Data Scientist

衛星影像資料

head(sat, 5)
  label V1  V2  V3 V4 V5
1     0 92 115 120 94 84
2     0 84 102 106 79 84
3     0 84 102 102 83 80
4     0 80 102 102 79 84
5     0 84  94 102 79 80
R 中的異常偵測入門

衛星影像資料

table(sat$label)
   0    1 
5732   71

棉花作物比例:

71 / 5803
0.01223505
R 中的異常偵測入門

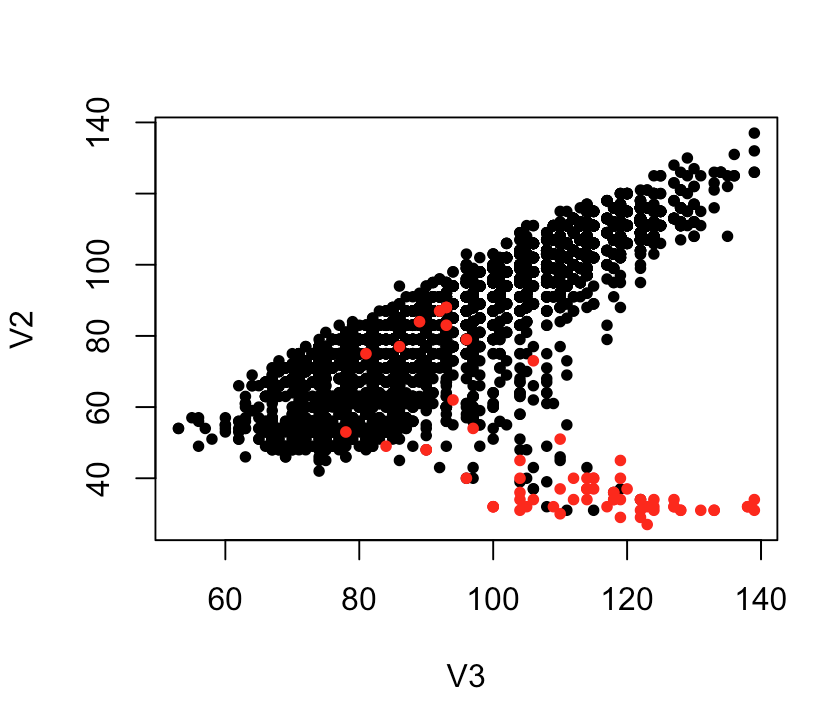
視覺化真實異常

plot(V2 ~ V3, data = sat, col = as.factor(label), pch = 20)
R 中的異常偵測入門

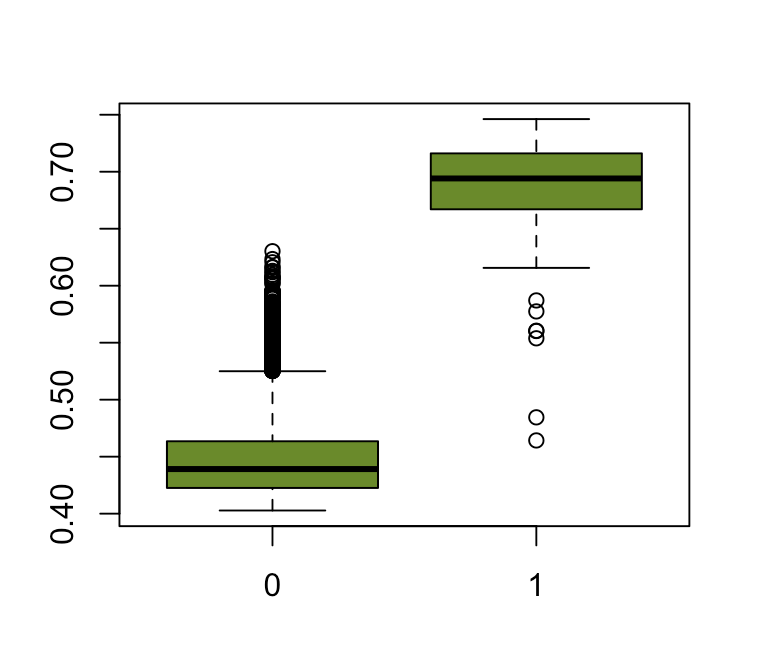
異常分數與真實標記

sat_for <- iForest(sat[, -1], nt = 100)
sat$score <- predict(sat_for, features)

boxplot(score ~ label, data = sat, col = "olivedrab4")
R 中的異常偵測入門

為何不直接用模型預測標記?

範例 1:偵測罕見疾病個案

  • 個案太少


範例 2:信用卡詐欺

  • 變化快速
R 中的異常偵測入門

一起來練習吧!

R 中的異常偵測入門

Preparing Video For Download...