用 Grubbs 檢定測試極端值

R 中的異常偵測入門

Alastair Rushworth

Data Scientist

目視評估並不總是可靠!

boxplot(temperature, ylab = "Celsius")
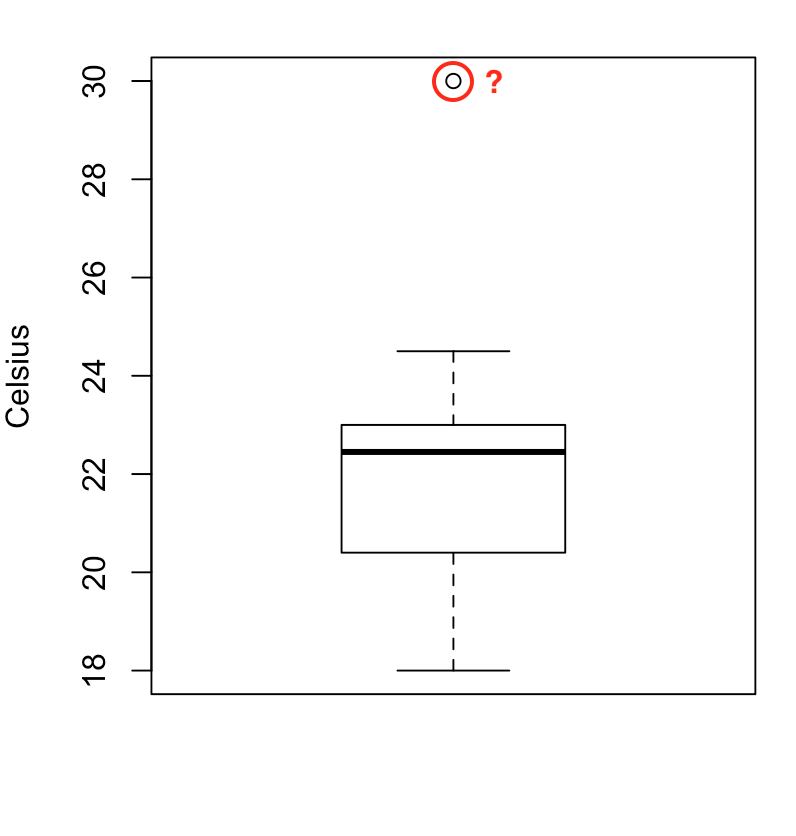
離群點的盒鬚圖

R 中的異常偵測入門

Grubbs 檢定

  • 用統計檢定判定資料點是否為離群值
  • 假設資料呈常態分布
  • 先檢查常態性假設
R 中的異常偵測入門

用長條圖檢查常態性

hist(temperature, breaks = 6)
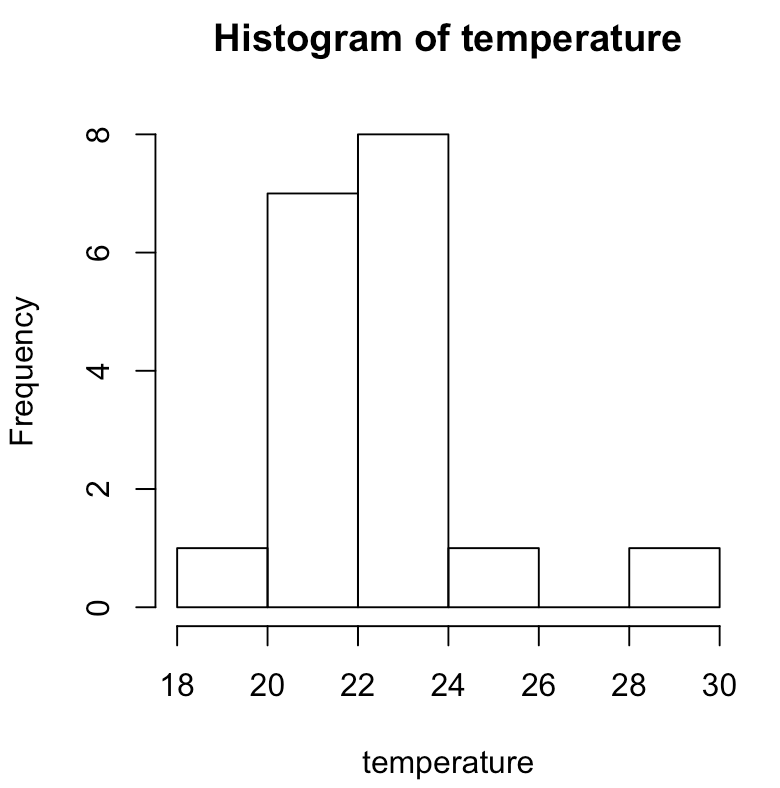
顯示資料分布的長條圖

對稱且鐘形嗎?

R 中的異常偵測入門

執行 Grubbs 檢定

使用 grubbs.test() 函式:

grubbs.test(temperature)
    Grubbs test for one outlier
data:  temp
G = 3.07610, U = 0.41065, p-value = 0.001796
alternative hypothesis: highest value 30 is an outlier
R 中的異常偵測入門

解讀 p-value

grubbs.test(temperature)
    Grubbs test for one outlier

data:  temperature
G = 3.07610, U = 0.41065, p-value = 0.001796
alternative hypothesis: highest value 30 is an outlier

  p-value

  • 越接近 0:離群證據越強
  • 越接近 1:離群證據越弱
R 中的異常偵測入門

取得離群值的列索引

最大值 的位置

which.max(weights)
5

最小值 的位置

which.min(temperature)
12
R 中的異常偵測入門

一起來練習吧!

R 中的異常偵測入門

Preparing Video For Download...