在季節性時間序列中偵測多個異常值

R 中的異常偵測入門

Alastair Rushworth

Data Scientist

每月營收資料

head(msales)
  sales month
1 6.068     1
2 5.966     2
3 6.133     3
4 6.230     4
5 6.407     5
6 6.433     6

Grubbs 檢定不適用於此

  • 可能存在季節性
  • 可能有多個異常值
R 中的異常偵測入門

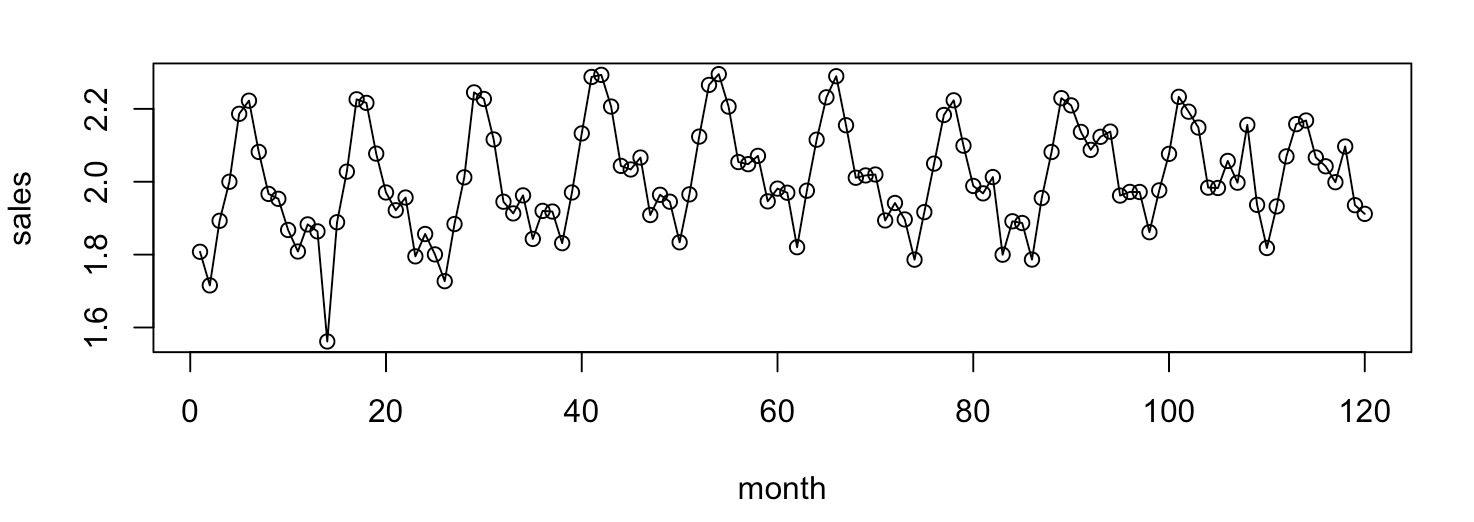
視覺化每月營收

plot(sales ~ month, data = msales, type = 'o')
R 中的異常偵測入門

Seasonal-Hybrid ESD 演算法用法

library(AnomalyDetection)
sales_ad <- AnomalyDetectionVec(x = msales$sales, period = 12, 
                                direction = 'both')

引數

  • x: 值的向量
  • period: 重複樣式的週期
  • direction: 尋找較小('neg')、較大('pos')或雙向('both')的異常值

套件下載:https://github.com/twitter/AnomalyDetection

R 中的異常偵測入門

Seasonal-Hybrid ESD 演算法輸出

sales_ad <- AnomalyDetectionVec(x = msales$sales, period = 12, 
                                direction = 'both')
sales_ad$anoms
  index anoms
1    14 1.561
2   108 2.156
R 中的異常偵測入門

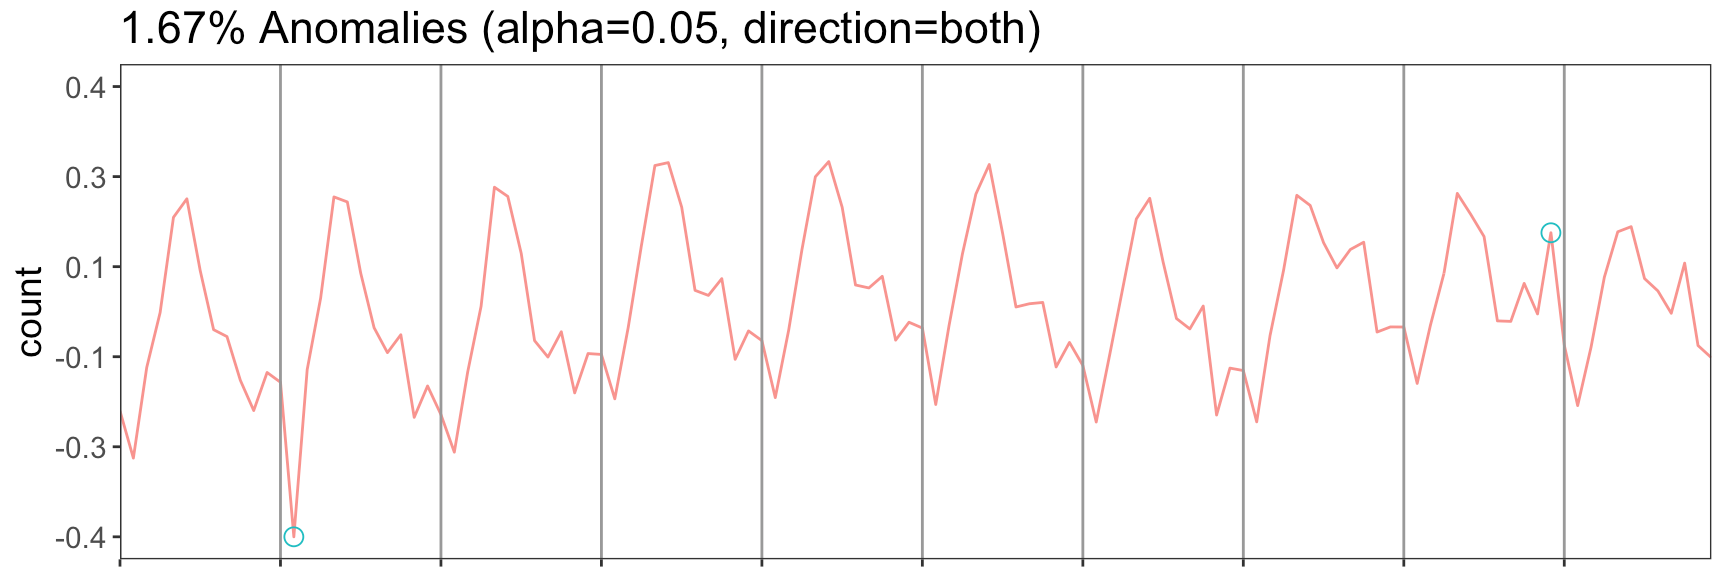
Seasonal-Hybrid ESD 演算法繪圖

AnomalyDetectionVec(x = msales$sales, period = 12, 
                    direction = 'both', plot = T)
R 中的異常偵測入門

一起來練習吧!

R 中的異常偵測入門

Preparing Video For Download...