Julia 資料視覺化入門
Gustavo Vieira Suñe
Data Analyst
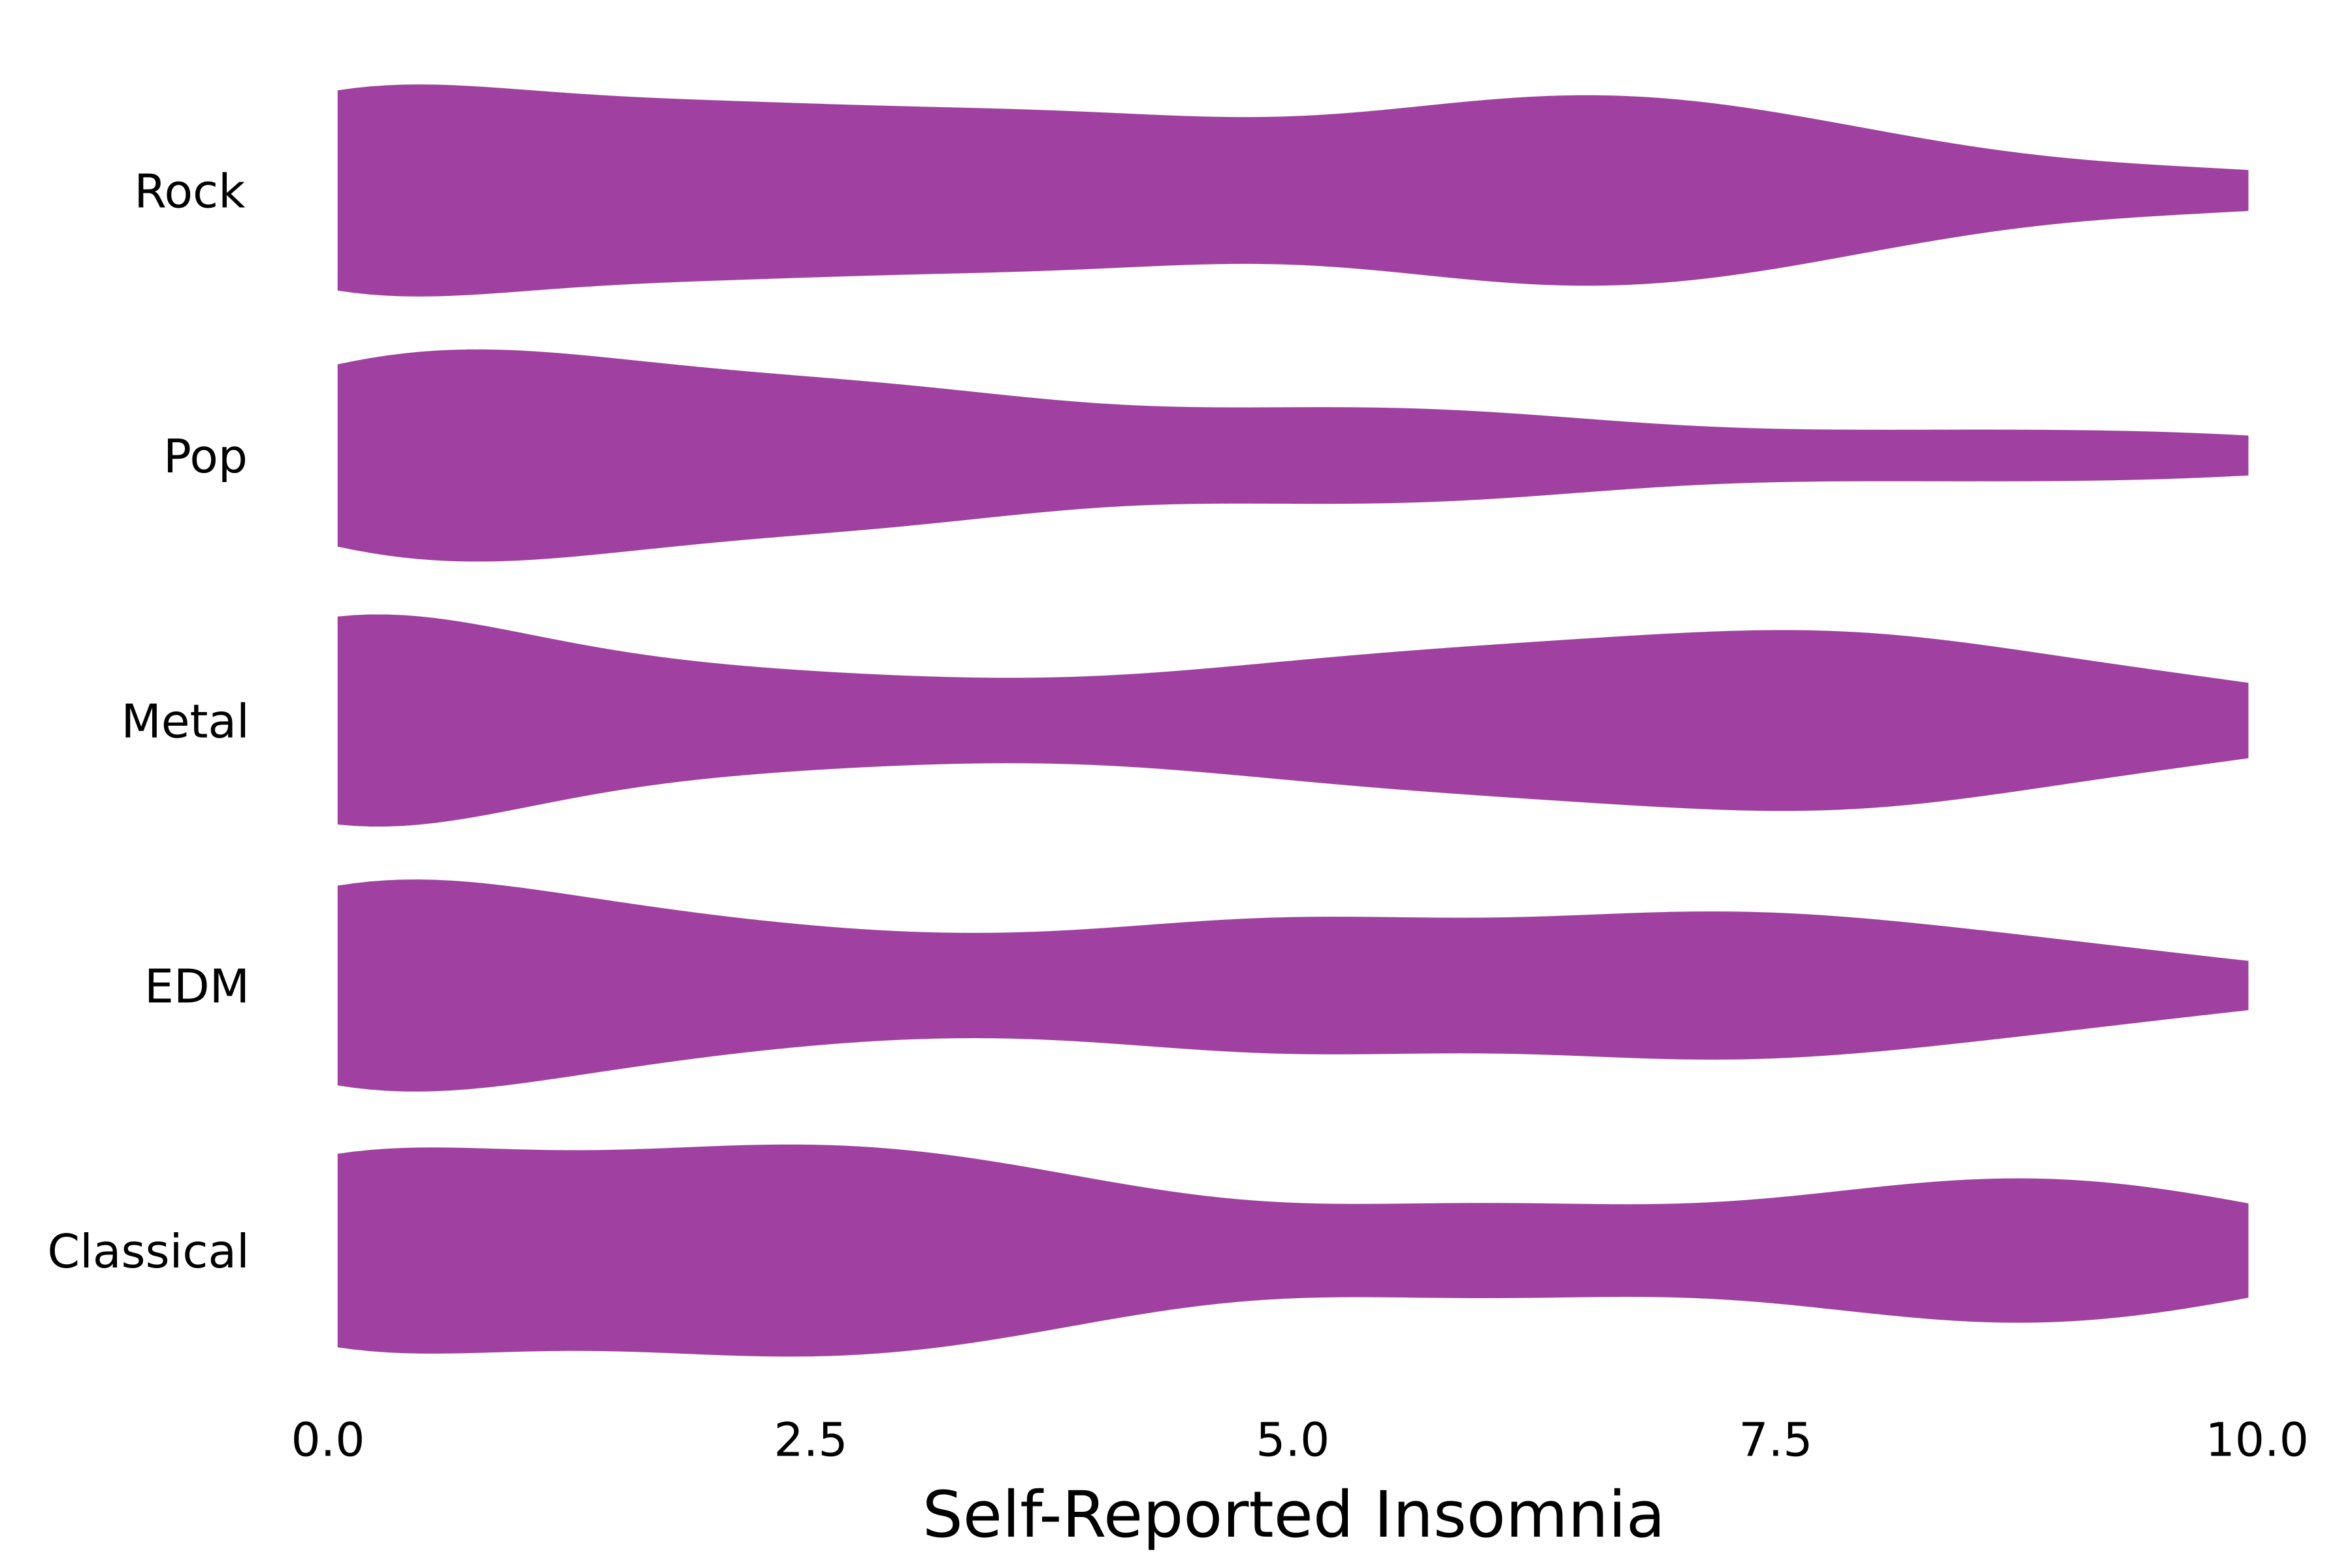
# Create a violin plot violin( streaming.Fav_genre, streaming.Insomnia, framestyle=:grid, label=false, linewidth=0,# Fill properties fillcolor=:purple, fillalpha=0.75,# Permute the axes permute=(:x, :y),# Remove grid lines grid=:off, )xlabel!("Self-Reported Insomnia")

plot(x, y) 的點是一種 :line 類型的序列:line、:scatter、:histogram、:density、:barscatter(x, [y1 y2]) 有兩個 :scatter 類型的序列# Create a violin plot plot( streaming.Fav_genre, streaming.Insomnia, framestyle=:grid, label=false, linewidth=0, fillcolor=:purple, fillalpha=0.75, permute=(:x, :y), grid=:off,# Specify series type seriestype=:violin, )xlabel!("Self-Reported Insomnia")

@recipe function f( ::Type{Val{:my_hviolin}}, x, y, z )# Series type seriestype := :violin# Customization options framestyle := :grid label := false linewidth := 0 fillcolor := :purple fillalpha := 0.75 permute := (:x, :y) end
::Type{Val{:my_hviolin}} 定義 my_hviolin 為序列配方名稱
x, y, z 代表序列資料
seriestype 指定配方所用的序列類型
客製化參數用 := 設定
# Use recipe plot( streaming.Fav_genre, streaming.Insomnia, # Specify series recipe seriestype=:my_hviolin, )xlabel!("Self-Reported Insomnia")

# Define my_hviolin function @shorthands my_hviolin# Use recipe my_hviolin( streaming.Fav_genre, streaming.Insomnia ) xlabel!("Self-Reported Insomnia")

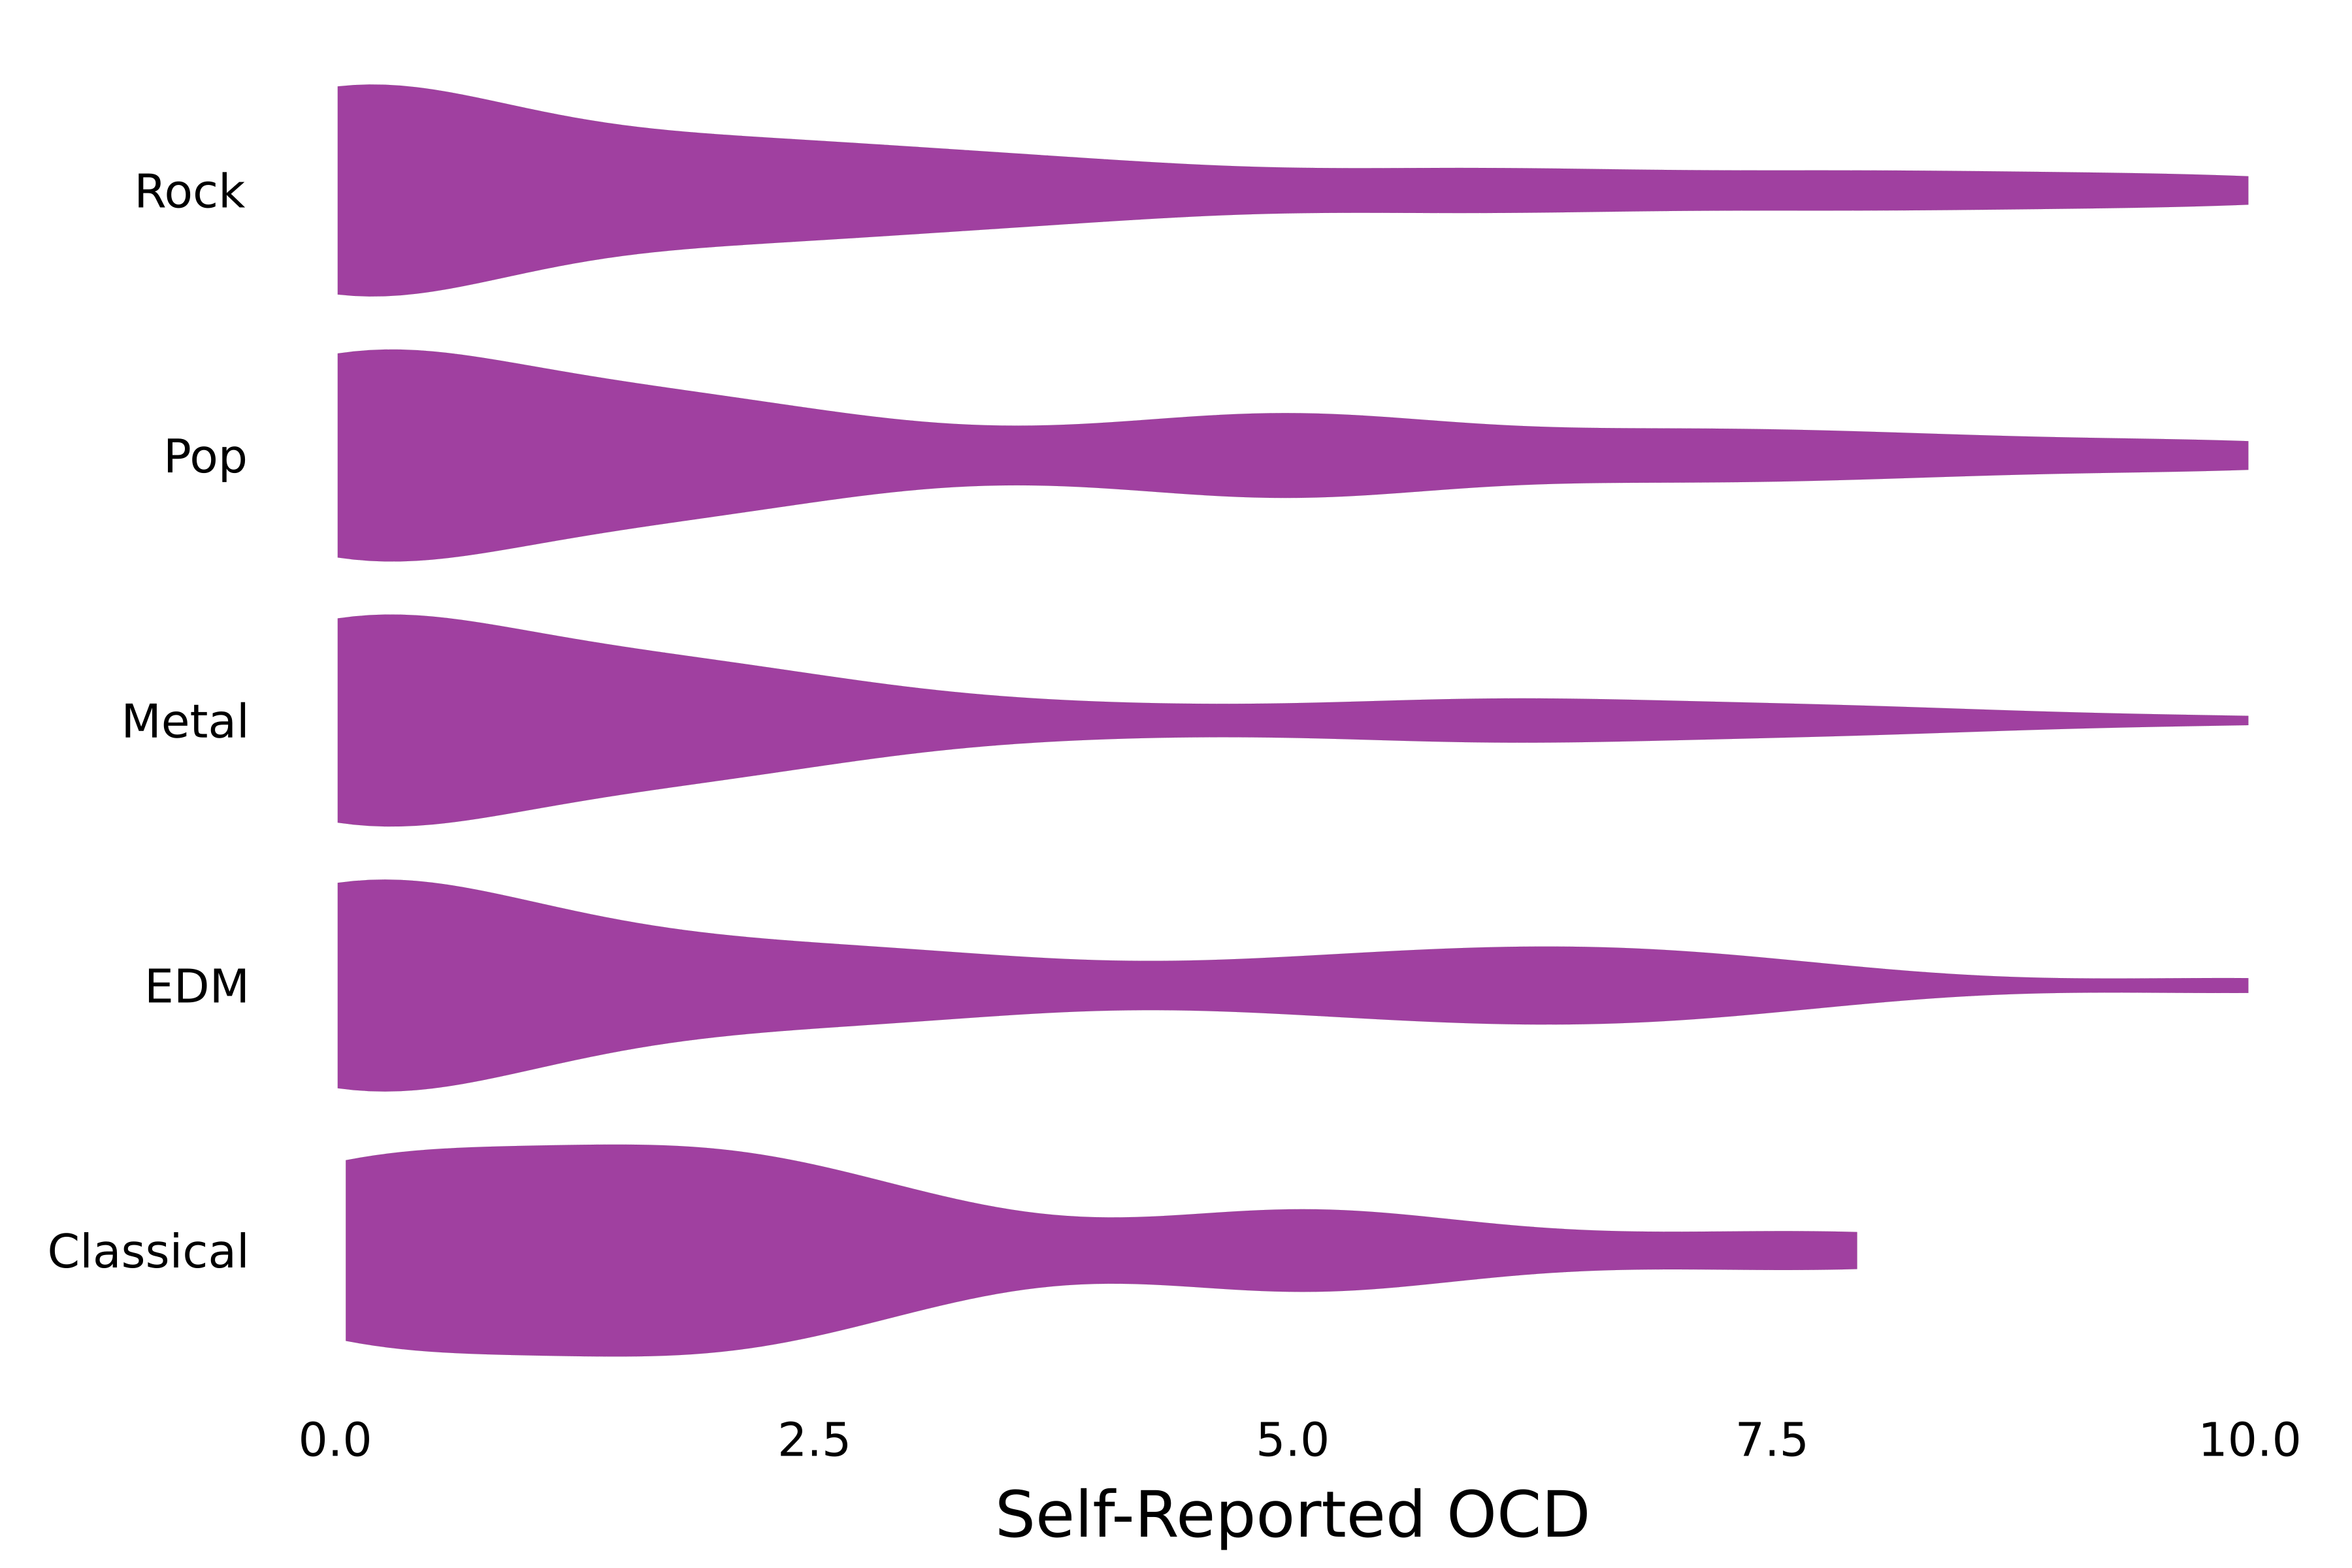
my_hviolin(streaming.Fav_genre,
streaming.OCD)
xlabel!("Self-Reported OCD")
my_hviolin(streaming.Fav_genre,
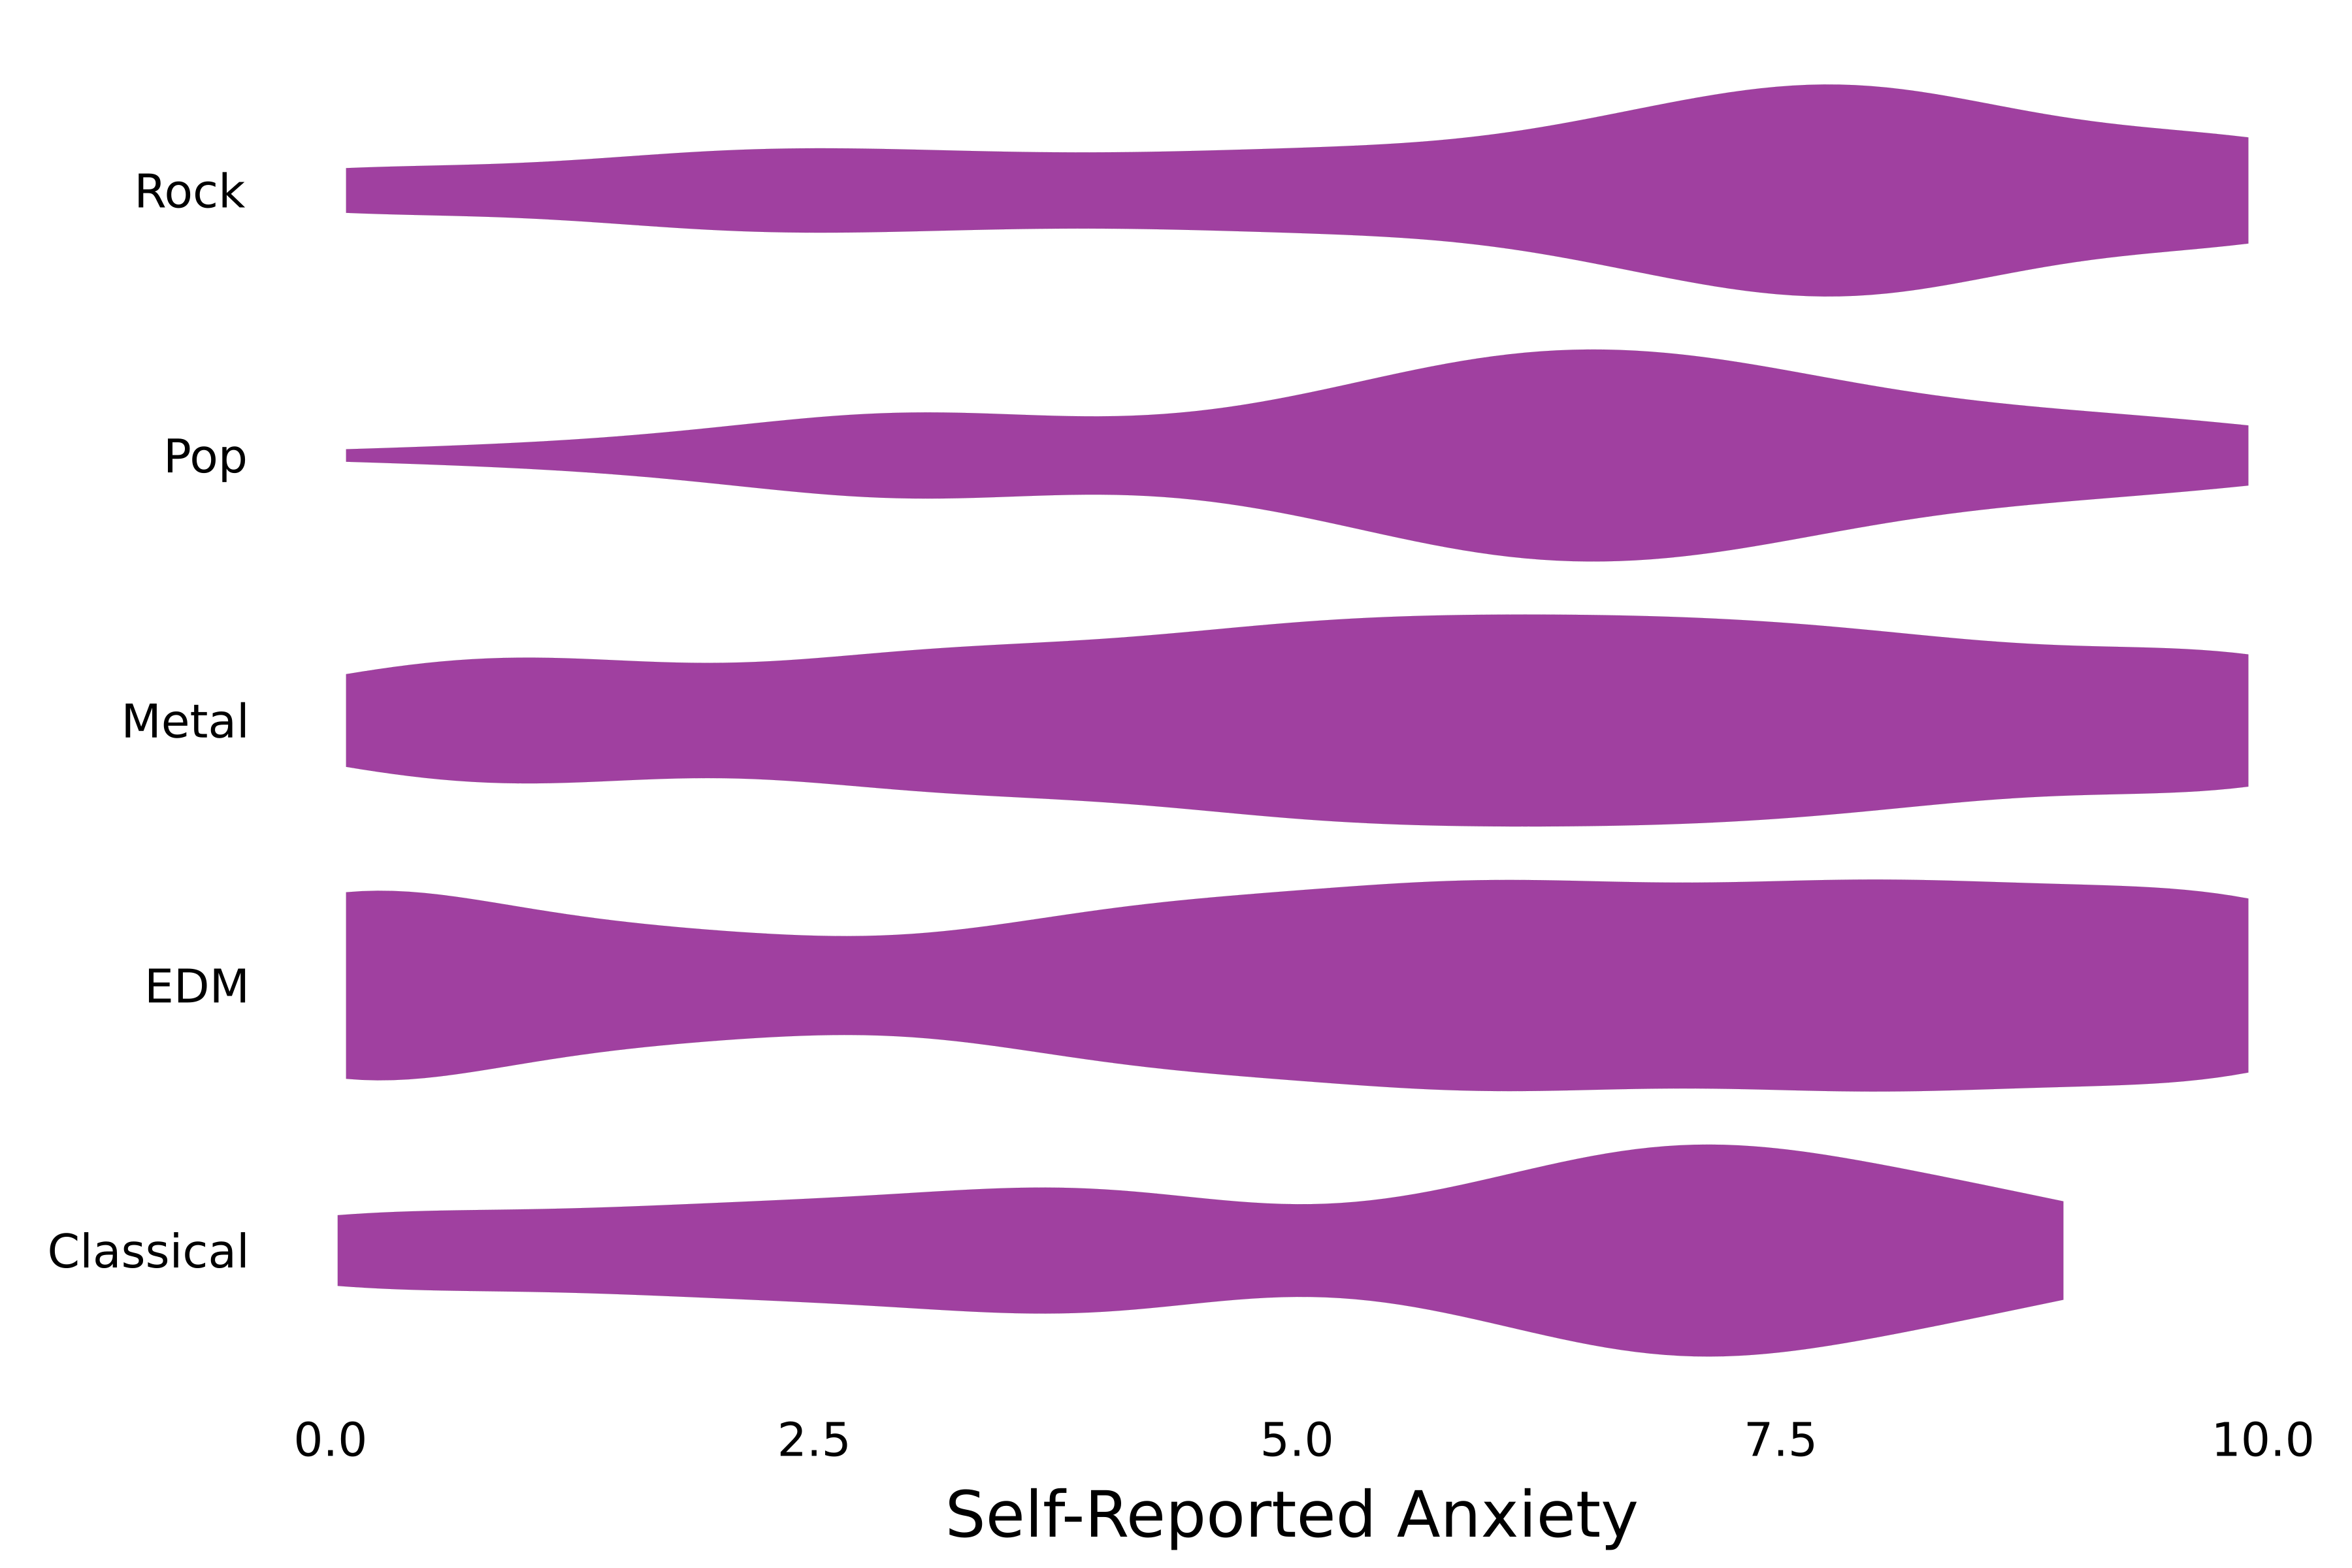
streaming.Anxiety)
xlabel!("Self-Reported Anxiety")

Julia 資料視覺化入門