using CSV, DataFrames
using Plots


# Load dataset
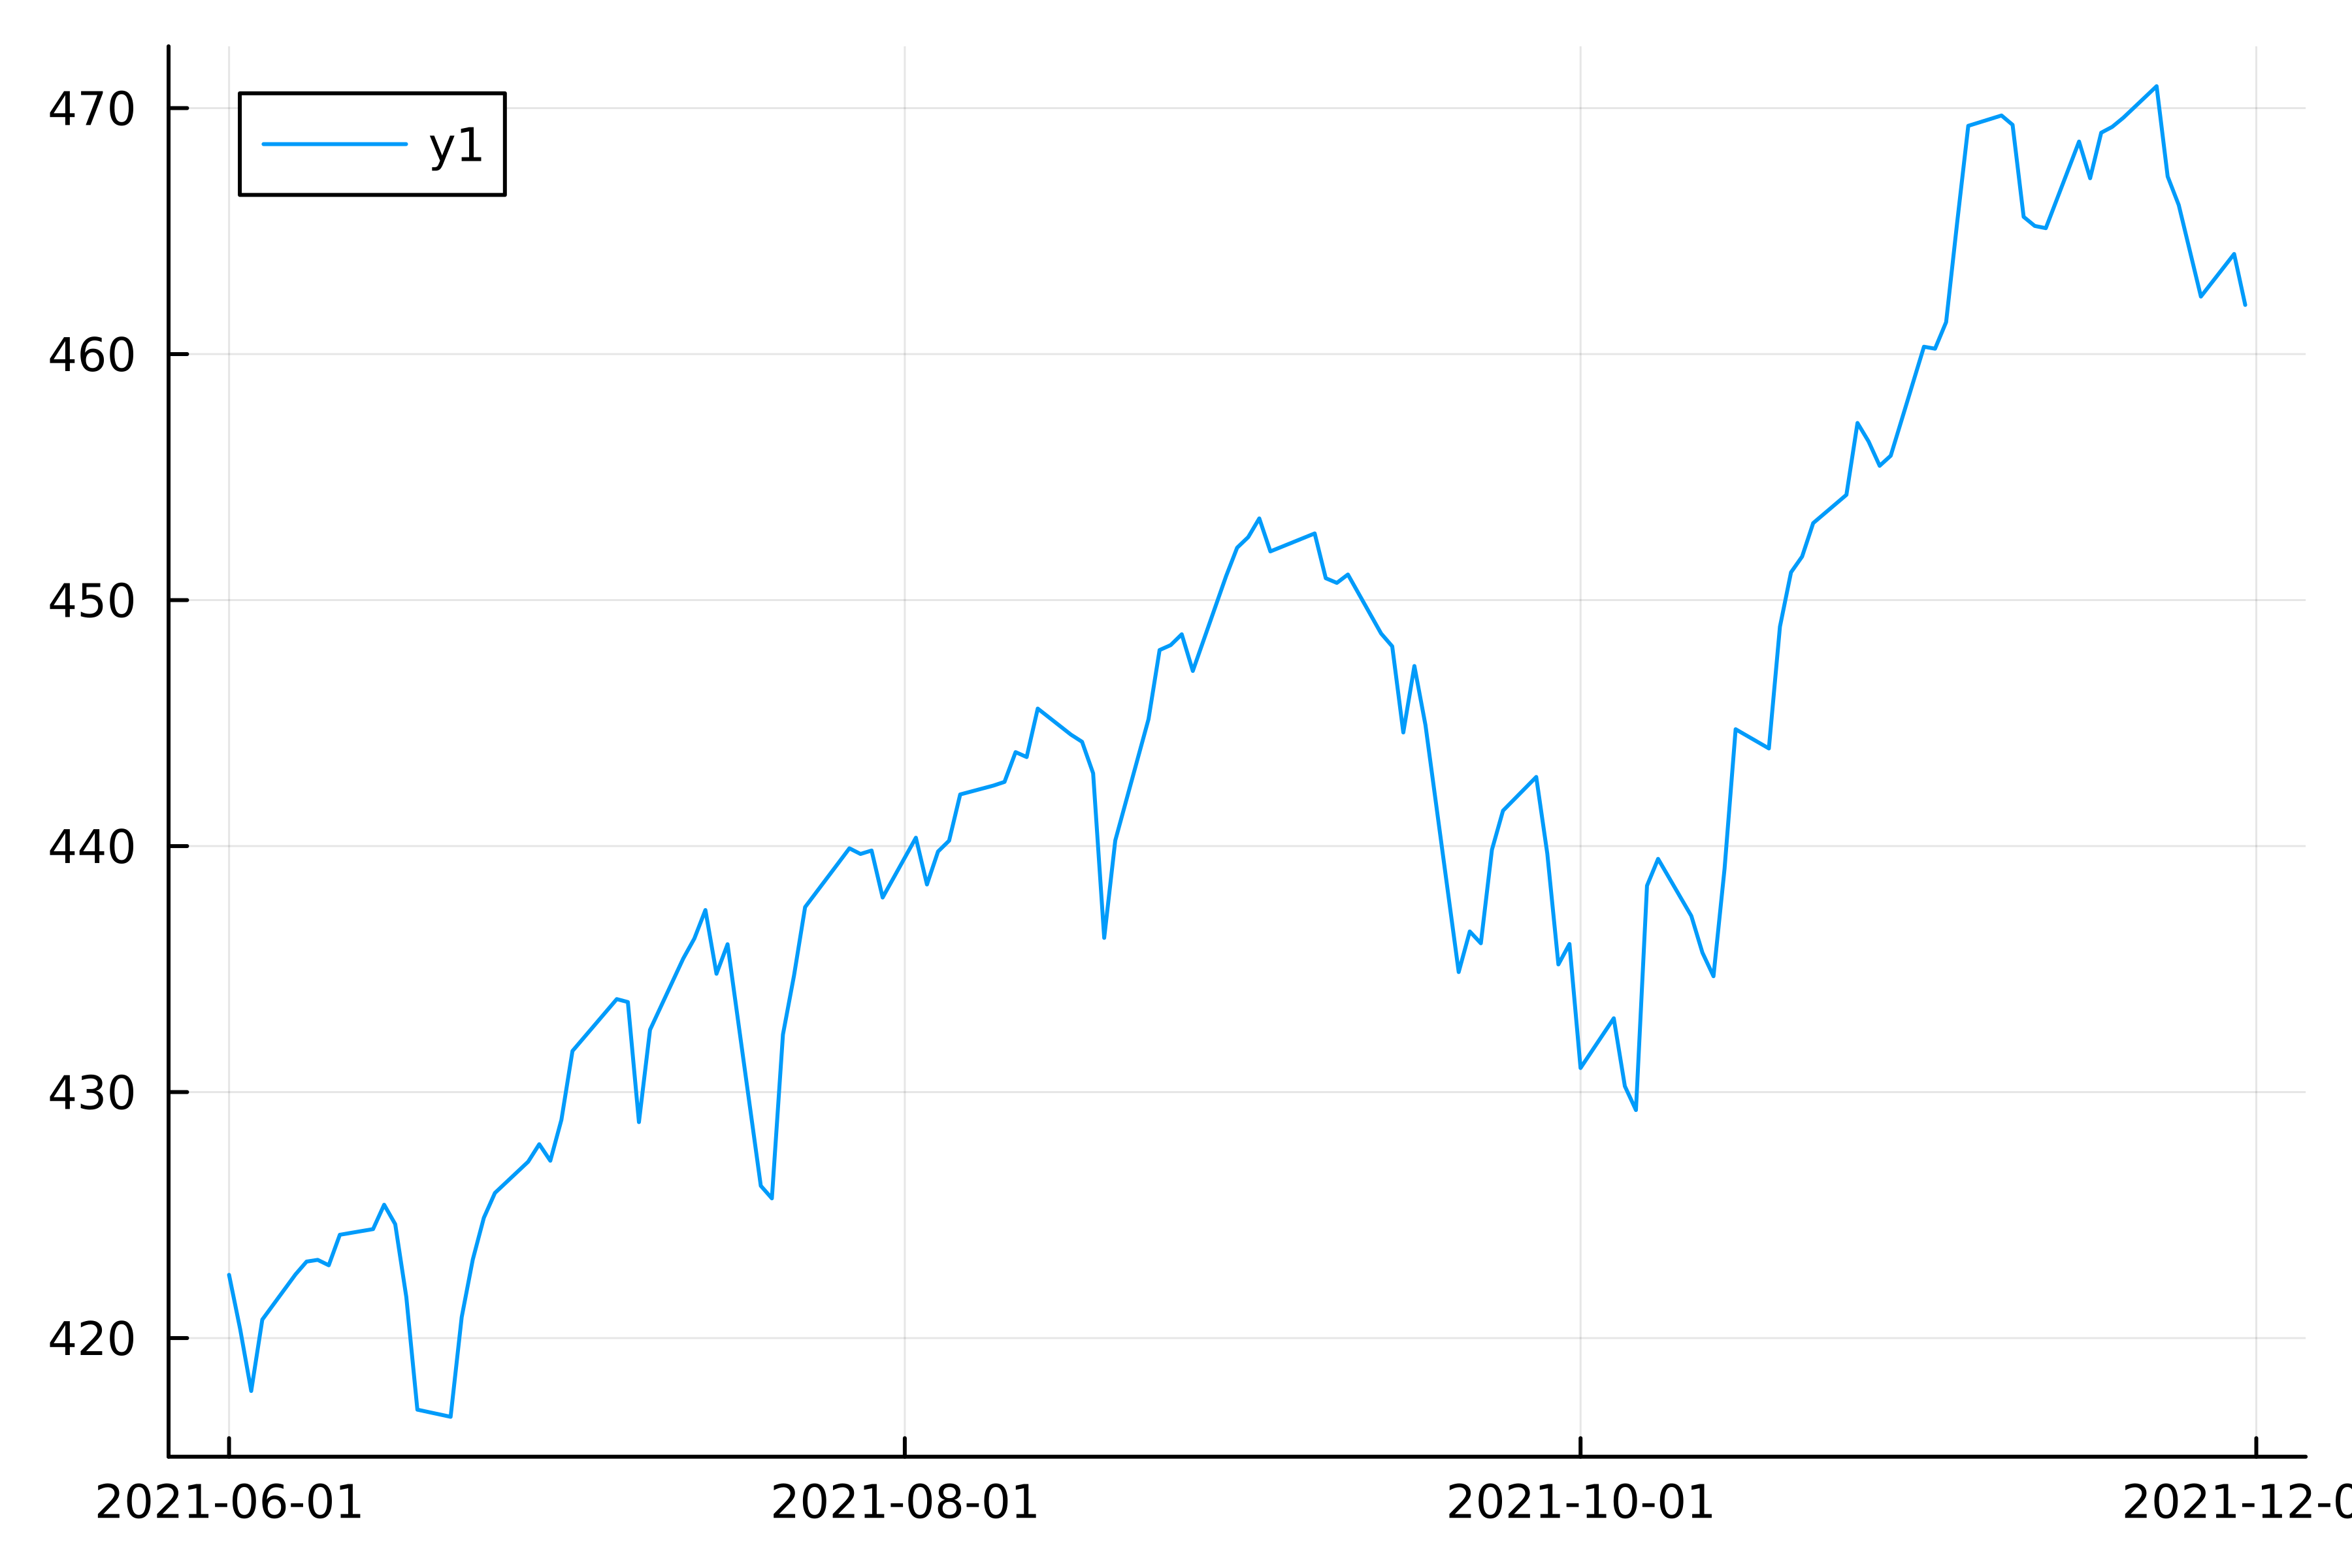
fund = DataFrame(CSV.File("fund.csv"))


# Plot prices over time
plot(
    # Values in x-axis
    fund.price_date,
    # Values in y-axis
    fund.open,
)
從折線到散點
using CSV, DataFrames
using Plots

# Load dataset
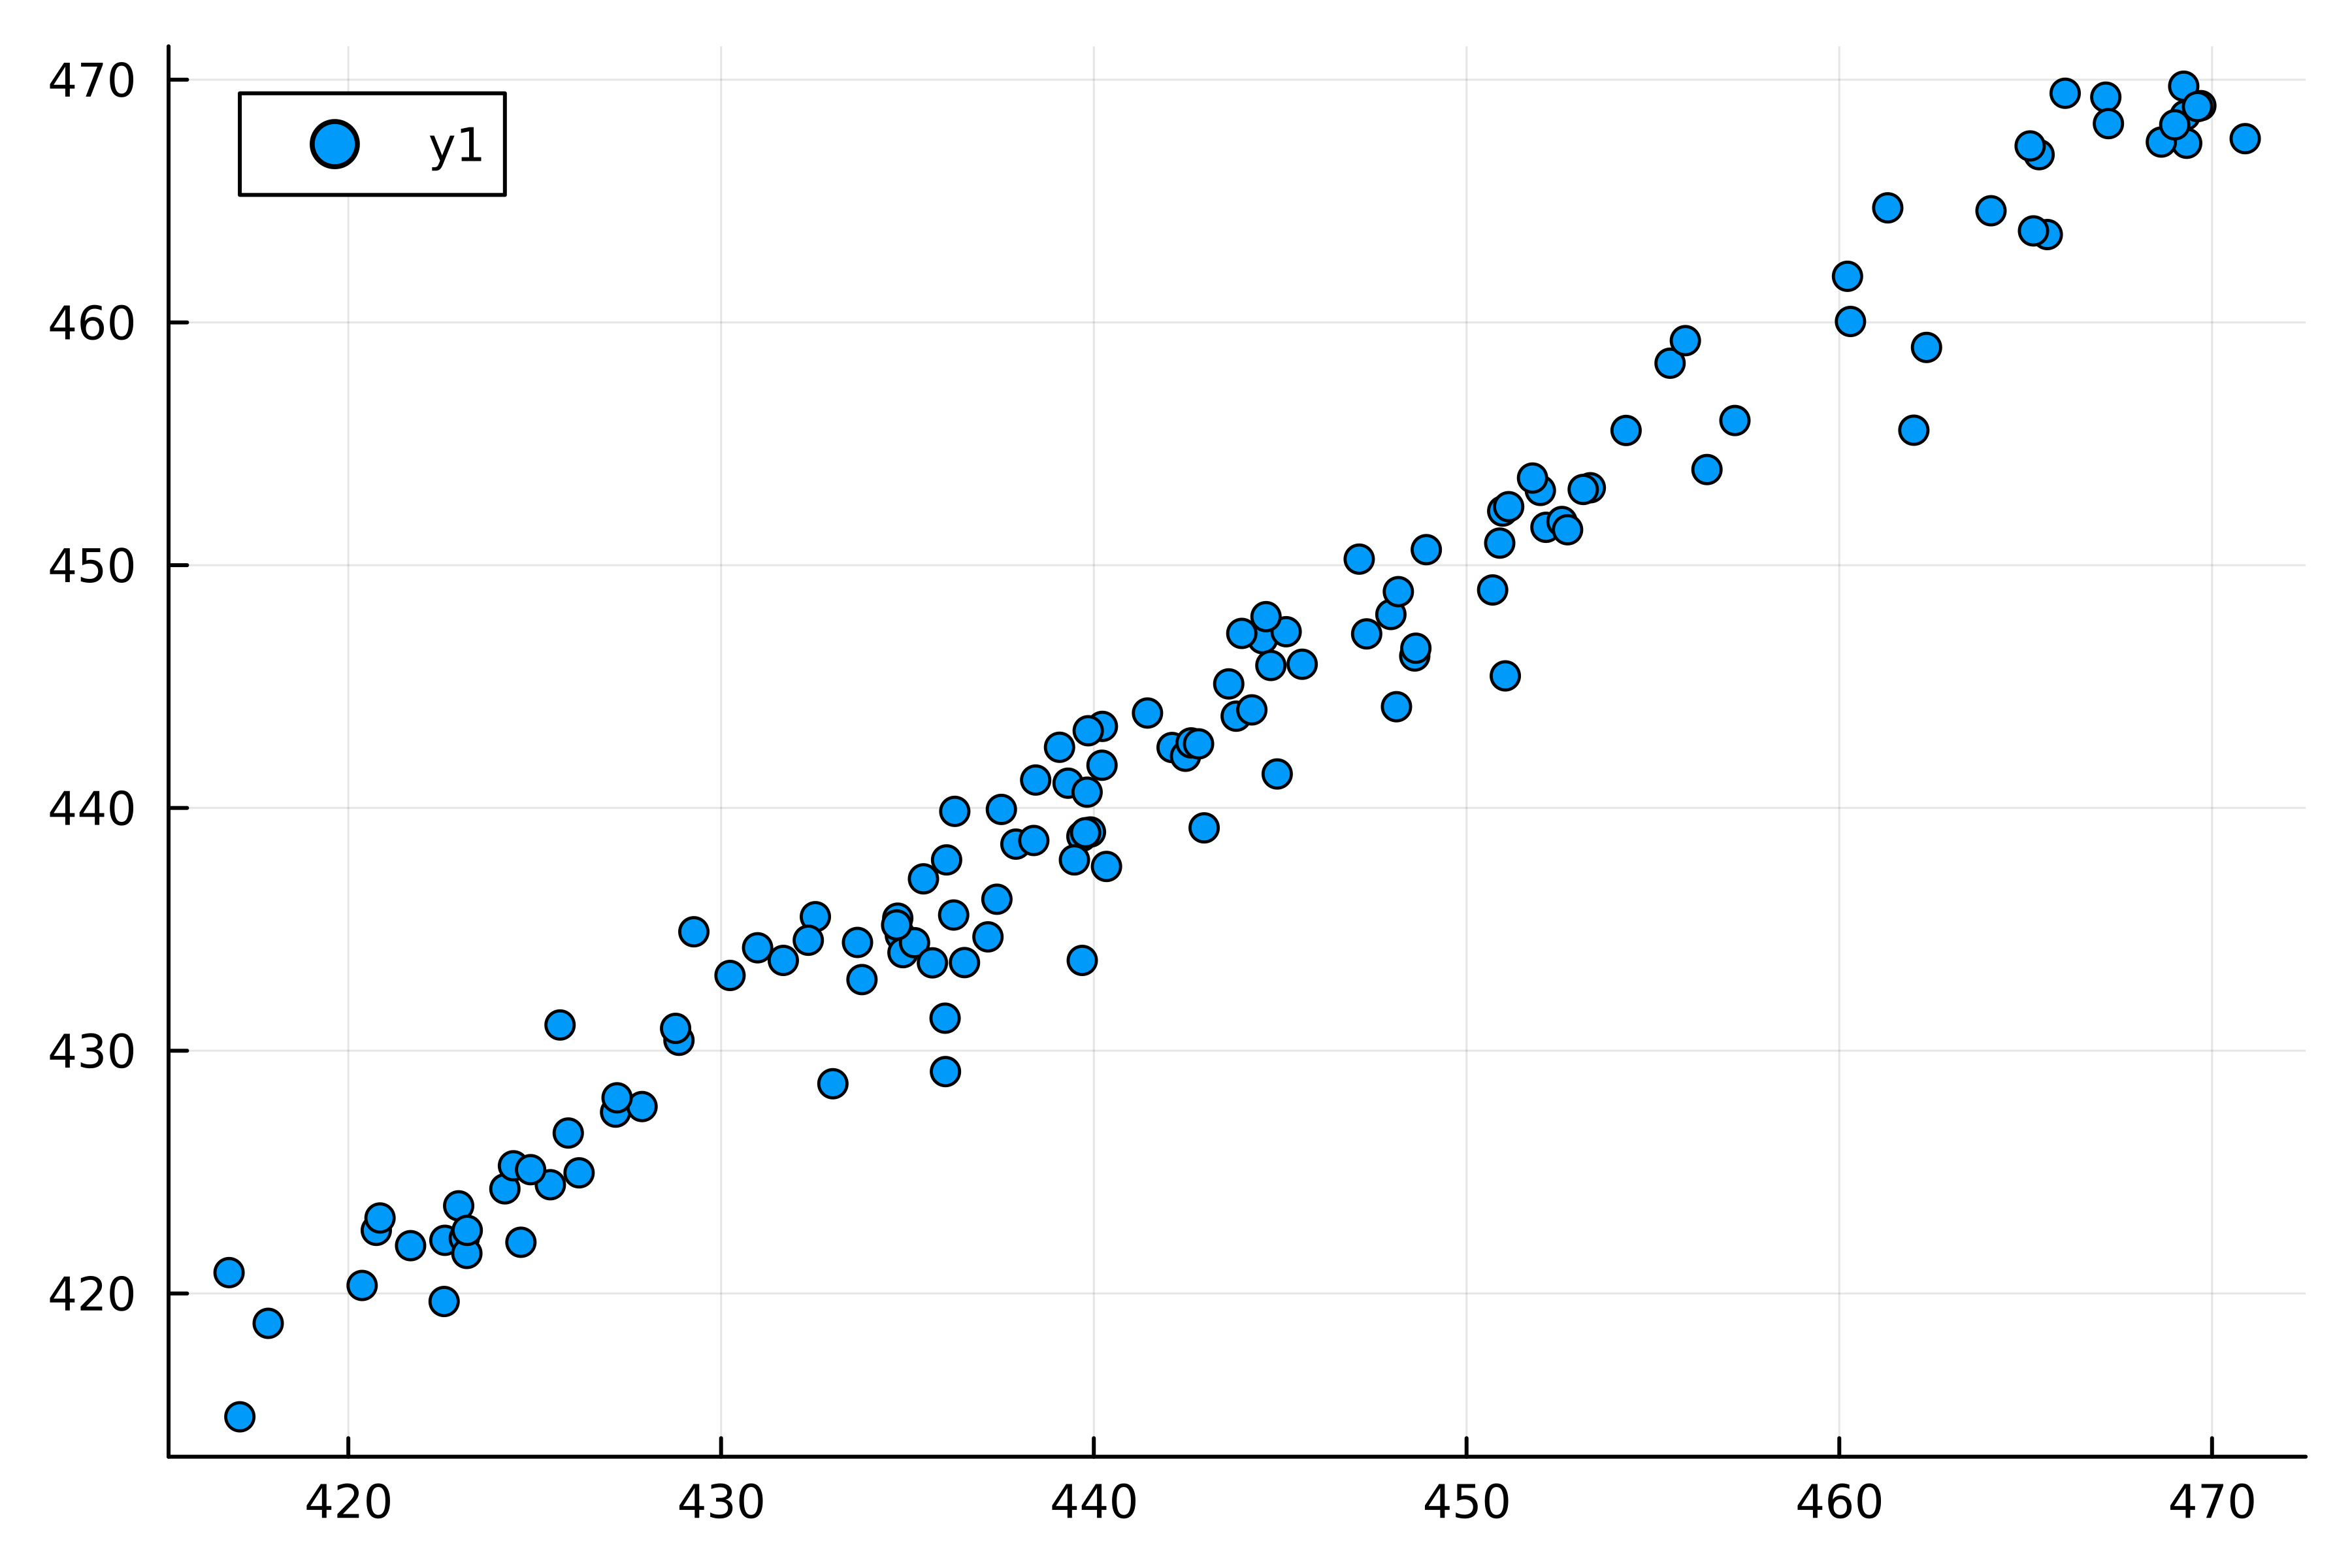
fund = DataFrame(CSV.File("fund.csv"))


# Plot open and close prices
scatter(
    # Values in x-axis
    fund.open,
    # Values in x-axis
    fund.close,
)
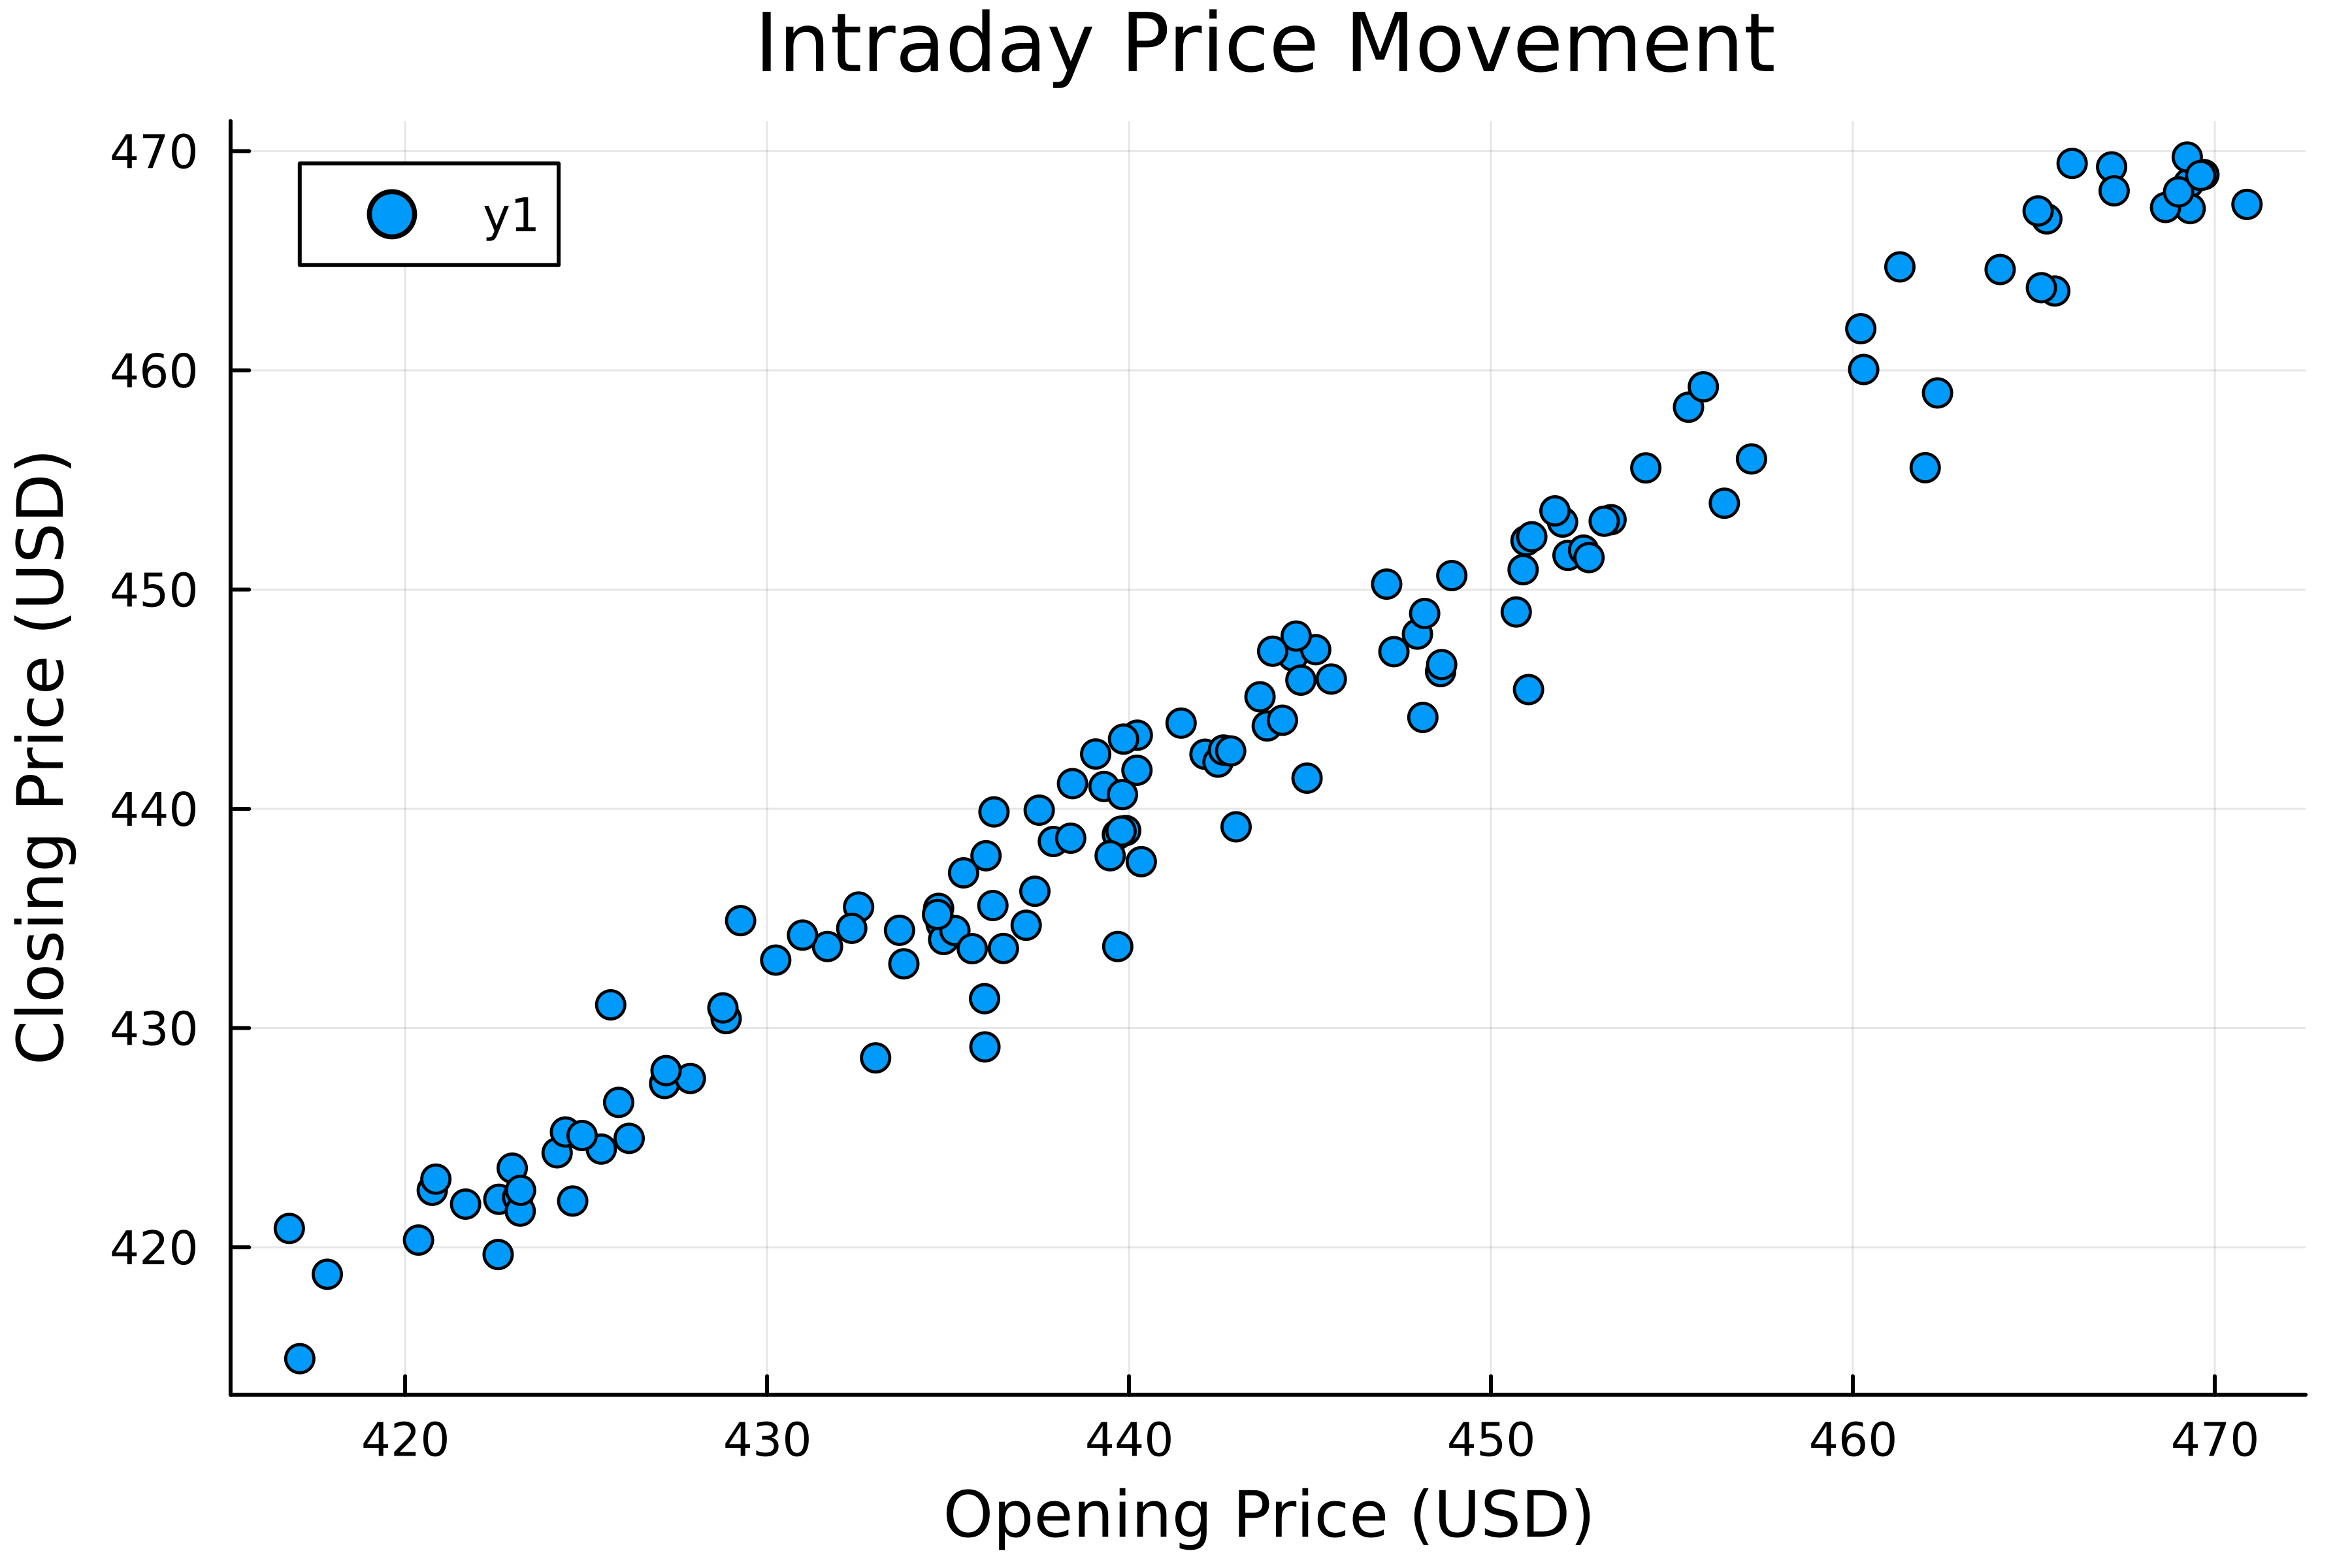
加入標題與座標軸標籤
# Plot open and close prices
scatter(
    fund.open,
    fund.close,

    # Add title
    title="Intraday Price Movement",

    # Add axis labels
    xlabel="Opening Price (USD)",
    ylabel="Closing Price (USD)",
)